Successfully pass the free certification exam at IW Academy and become an Infinet Certified Engineer.
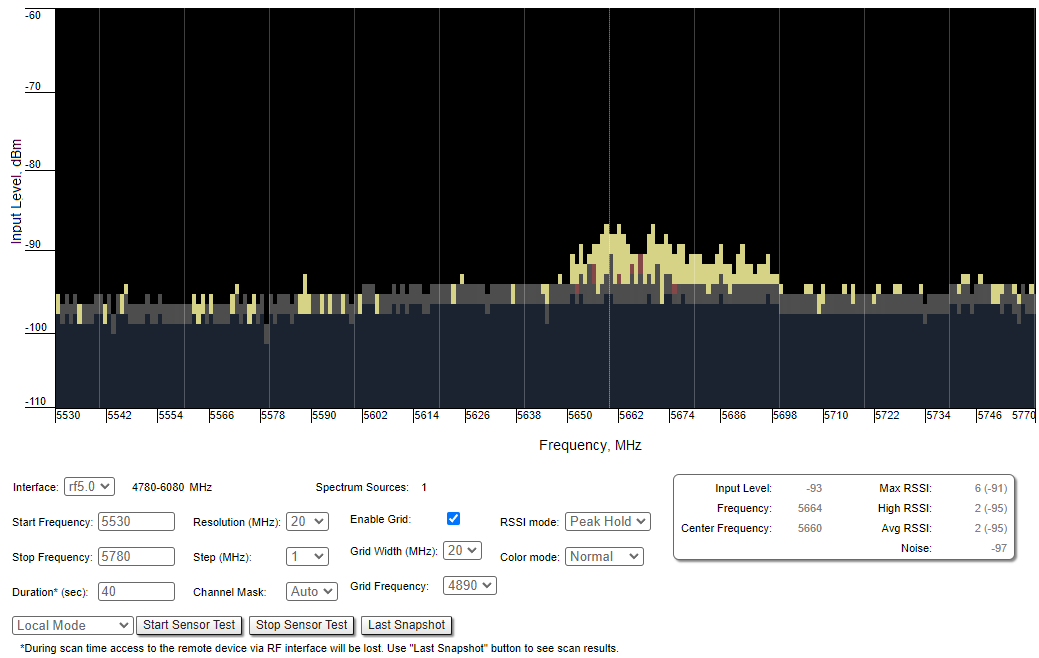
In the "Spectrum Analyzer" menu, you can perform a deep analysis of the radio emissions in the environment where the unit is placed. The unit scans the radio spectrum on all available frequencies. In order to obtain the information as accurate as possible, the scanning process may take a while.
CAUTION
When running spectrum scan on a unit accessible via the RF interface, connection will be lost during scan time (the radio-link will be disconnected). Use "Last Snapshot" button to see scan results.
The following parameters are available in order to operate the Spectrum Analyzer:
| Parameter | Description |
|---|---|
Interface |
|
Start Frequency |
|
Stop Frequency |
|
Band |
|
Step |
|
Channel Mask |
|
Scan Duration |
|
Enable Grid |
|
Grid Width |
|
Grid Frequency |
|
RSSI mode |
|
| Scan mode |
|
Start/stop Spectrum Analyzer by clicking the «Start Sensor Test»/«Stop Sensor Test» buttons.
By clicking the «Last Snapshot» button, you get the final scanning results. The most common usage of this feature is when you perform a spectrum scan at the remote unit on the other side of the radio link. When running a spectrum scan at such a unit (accessible via the RF interface), connection to this unit will be lost for a scan time. "Last Snapshot" option allows viewing scan results when the connection gets up again.
When you run spectrum scan on a local unit and the link is interrupted, the remote unit will not disappear from the spectrum picture. So you should silence the remote unit in order to have a real picture without it, otherwise you will always see noise signal on the operating frequency generated by the remote unit.
You can get detailed information about the scanned radio signals on a specific frequency. Just point a cursor on the needed frequency and you will see a hint with exact Signal level (dBm), Frequency (MHz), Noise Floor (dBm), indicators of RSSI (dBm), High RSSI (dBm), Max RSSI (dBm) and their values in dB. High RSSI allows you to estimate the signal sources number, if the value is significantly different from the average RSSI, then there are several sources of interference.