...
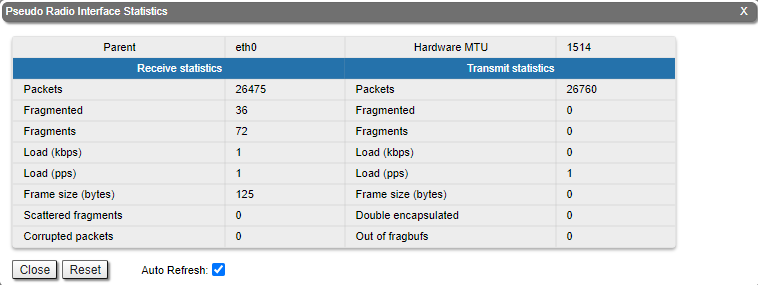
For the pseudo-radio interface information about parent interface, MTU value and load statistics is available.
| Center | |||||||
|---|---|---|---|---|---|---|---|
|
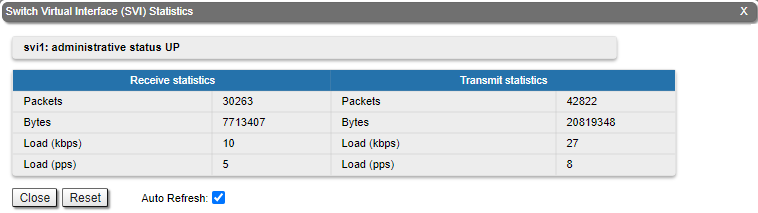
For the SVI interface information about current status, RX and TX staistics is available.
| Center | |||||||
|---|---|---|---|---|---|---|---|
|
...
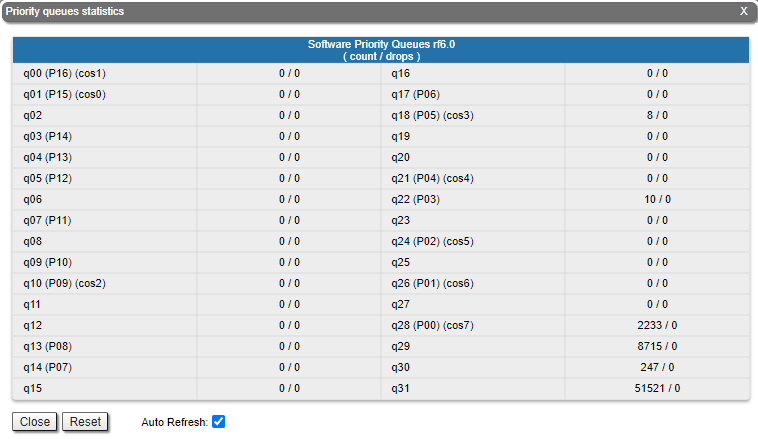
This section displays the number of inbound packets to each priority queue and the number of dropped packets. Of the 32 priority queues 17 are available for user configuration (from P00 to P16), where 0 is the highest priority. The rest are reserved for the system. Packets with 802.1p priority are distributed to queues with "cosX" values.
| Center | |||||||
|---|---|---|---|---|---|---|---|
|
...
The "Network Address Table" tool shows the network address table for the interface.
| Center | |||||||
|---|---|---|---|---|---|---|---|
|

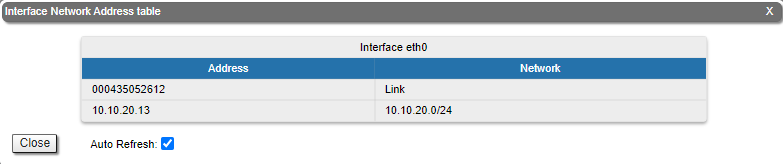
By clicking the «Close» button, you return to the "Device Status" page.
...
The "LLDP Information" tool allows to get information on the link layer discovery protocol.
| Center | |||||||
|---|---|---|---|---|---|---|---|
|
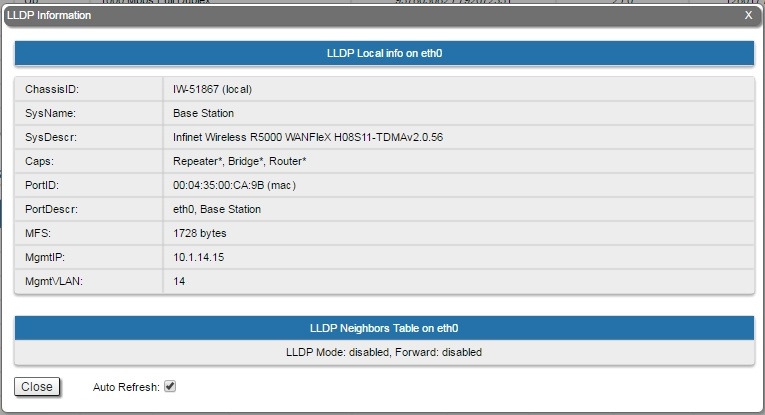
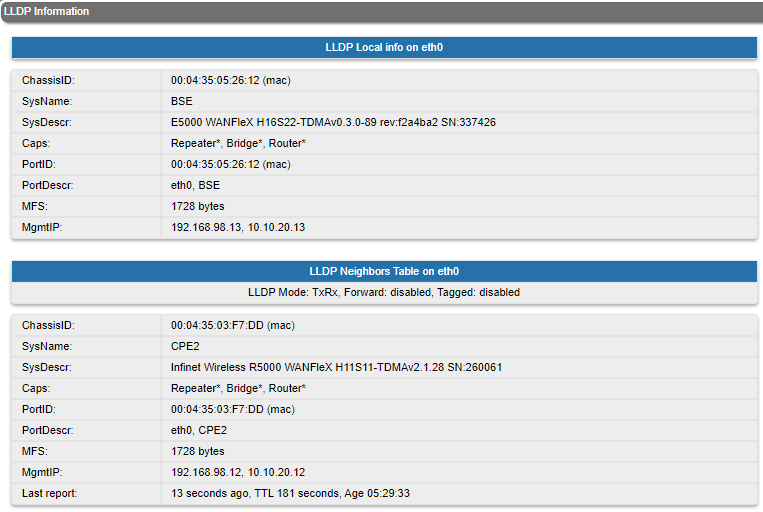
By clicking the «Close» button, you return to the "Device Status" page.
...
In order to access the "Extended Link Diagnostics" tools, click on the row of each wireless link within the "Links Statistics on rf5rf6.0" section:
| Center | |||||||
|---|---|---|---|---|---|---|---|
|
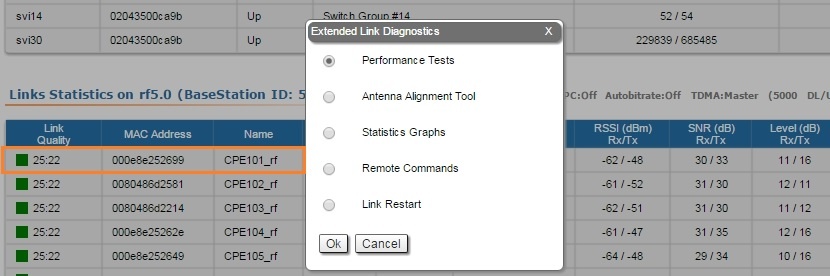
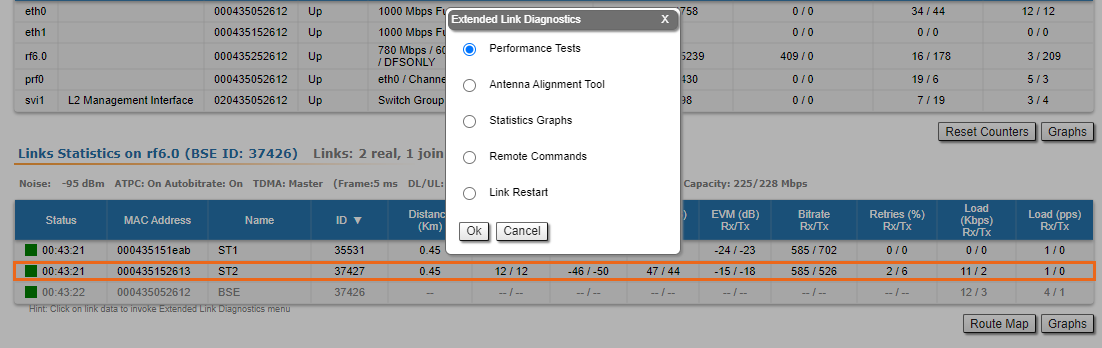
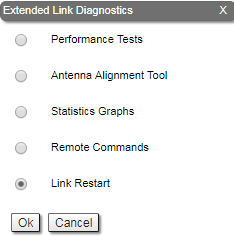
Five options are available: "Performance Tests", "Antenna Alignment Tool", "Statistics Graphs", "Remote Commands" and "Link Restart".
...
Performance tests contains of 8 tests performed on established bitrate, test can be performed in one direction or bidirectionally.
| Center | |||||||
|---|---|---|---|---|---|---|---|
|

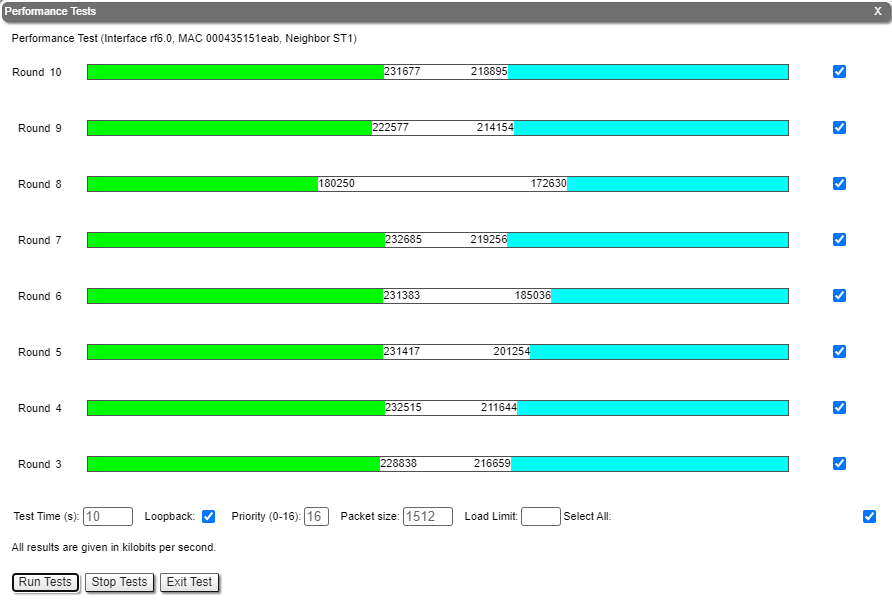
By clicking the «Run Tests»/«Stop Tests» buttons at the bottom of the page, you can start/stop the performance tests.
...
The accuracy of the antenna alignment at the neighbor device is very important for the link quality.
| Center | |||||||
|---|---|---|---|---|---|---|---|
|
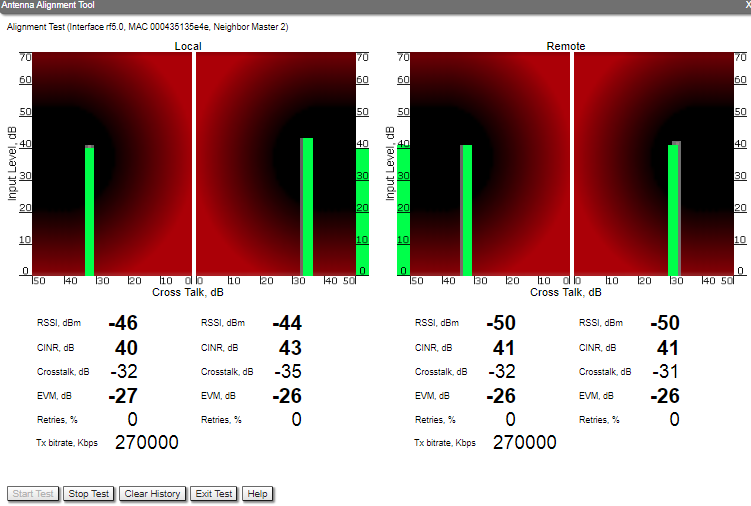
By clicking the «Start Test»/«Stop Test» buttons at the bottom of the page, you can start/stop the alignment test.
...
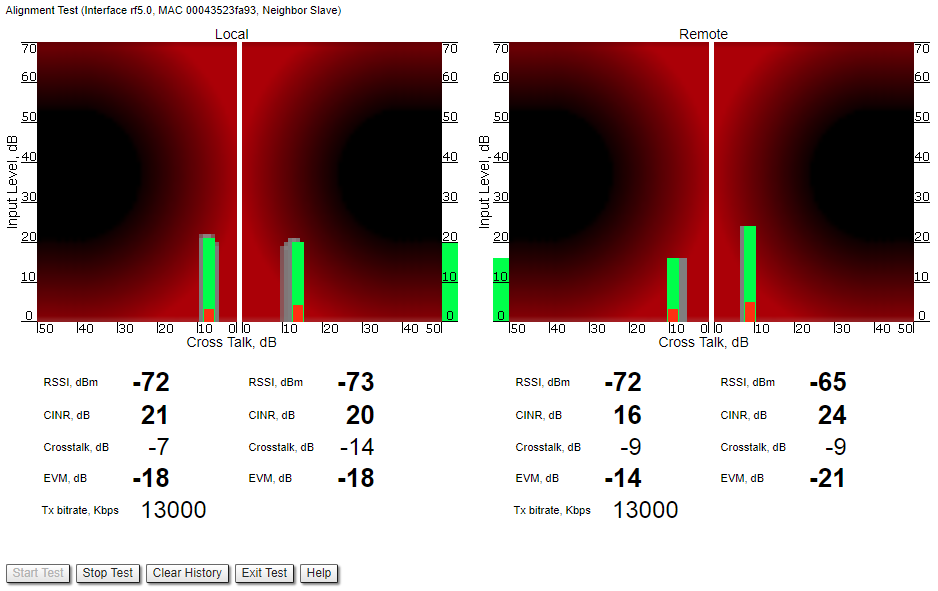
ALL described recommendations are applicable to both ("Local" and "Remote") sections.
Link samples:
- Good link sample
| Center | |||||
|---|---|---|---|---|---|
|

- Bad link sample
| Center | |||||
|---|---|---|---|---|---|
|
Statistics Graphs
...
Statistics Graphs
The "Statistics Graphs" tool has been developed based on “digraphs”, which is a fast, flexible open source JavaScript charting library.
...
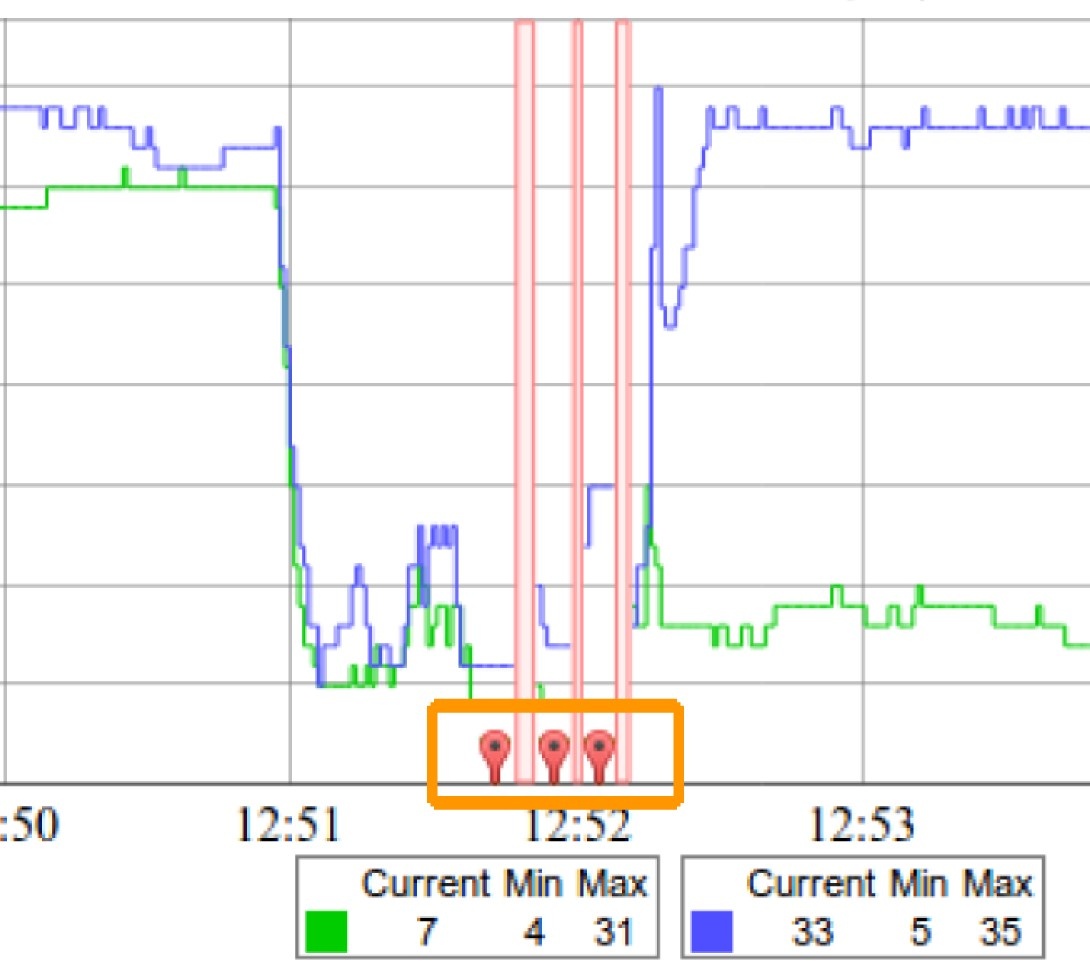
Critical events like link outages or frequency swaps are marked by small red balloons on the bottom of each graph. Move the mouse over each balloon for details:
| Center | |||||||
|---|---|---|---|---|---|---|---|
|
Working with the charts:
...
The parameters that can be monitored are:
| Center | |||||||
|---|---|---|---|---|---|---|---|
|

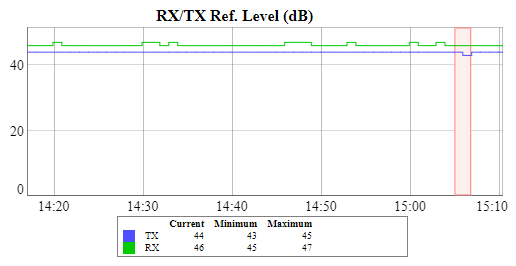
This chart displays the measured RX (green) and TX (blue) signal levels. Red regions represent link outages. The default graph uses the CINR measurement method; however, the RSSI method can be selected from the drop-down menu.
| Center | |||||||
|---|---|---|---|---|---|---|---|
|


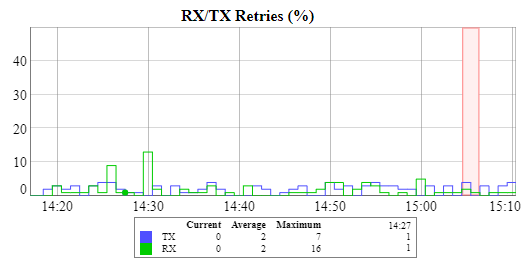
This chart displays the retry percentage (it provides a quick estimation of the link quality). Similar to the previous graph, RX retries are represented by the green lines, TX retries by the blue lines and link outages by the red lines.
| Center | |||||||
|---|---|---|---|---|---|---|---|
|

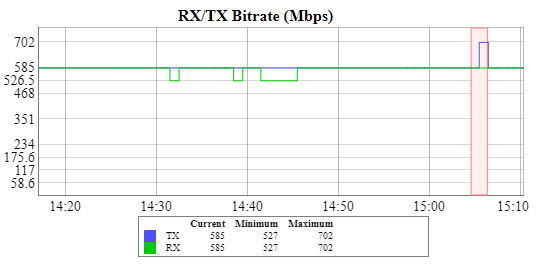
The Bitrate chart displays the bitrate for each of the two units in the link. These parameters indicate the link quality, too.
| Center | |||||||
|---|---|---|---|---|---|---|---|
|

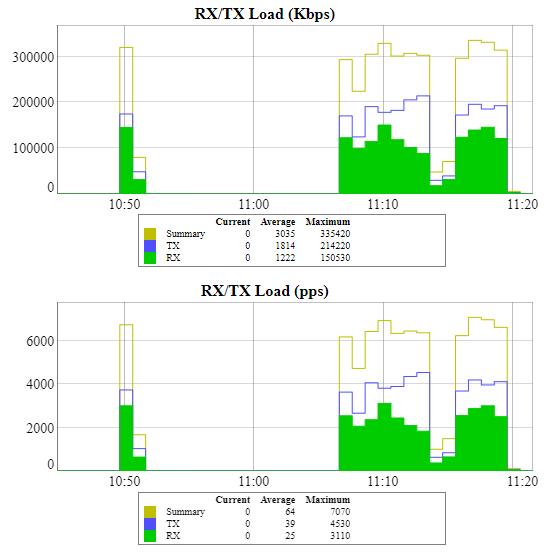
The load charts display the actual link load information, either in real time or for a set period of time. The yellow lines represent the total link load, the green lines represent the RX load and the blue lines represent the TX load.
| Center | |||||||
|---|---|---|---|---|---|---|---|
|

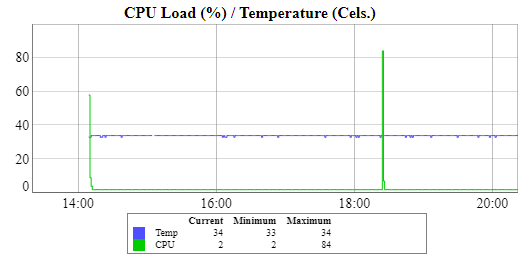
The last chart displays the current CPU load and unit temperature (only for the units equipped with temperature sensors).
...
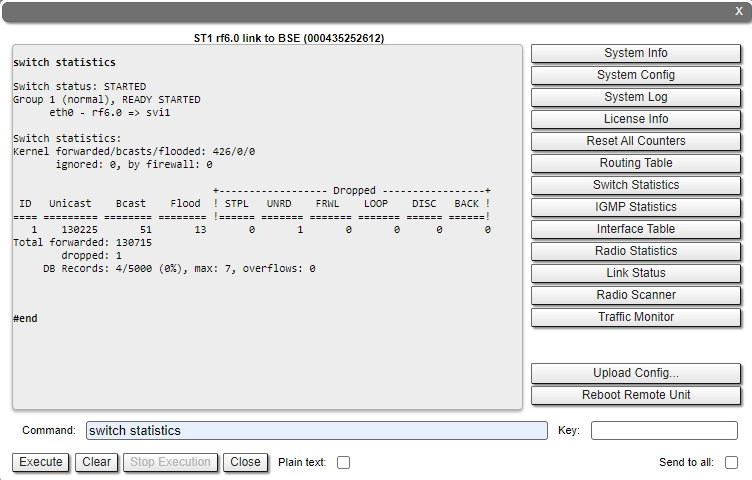
For the ease of usage of the "Remote Commands" tool, the corresponding buttons for the most used WANFleX OS CLI commands are available in the right side of the screen:
| Center | |||||||
|---|---|---|---|---|---|---|---|
|

By clicking the «System Info» button, you fill in the command field with "system version, system uptime and system cpu" commands.
By clicking the «System Config» button, you fill in the command field with "system uptime and config show" commands.
By clicking the «System Log» button, you fill in the command field with "system log show" command.
By clicking the «Routing Table» button, you fill in the command field with "netstat -r" command.
By clicking the «ARP Table» button, you fill in the command field with "arp view" command.
By clicking the «Switch Statistics» button, you fill in the command field with "switch statistics" command.
By clicking the «Link Status» button, you fill in the command field with "mint map detail" command.
By clicking the «Interface Table» button, you fill in the command field with "netstat-i" command.
By clicking the «Radio Scanner» button, you fill in the command field with "muffer rf5rf6.0 -t5 -p mac3" command.
All commands are executed automatically after clicking one of the buttons mentioned above.
| Note | ||
|---|---|---|
| ||
All WANFleX OS CLI commands can be executed from the "Remote Commands" tool. |
Link Restart
You can restart the wireless link (re-association, re-authentication and re-connection) by selecting the “Link Restart” radio button and then by clicking the «OK» button in the link options.
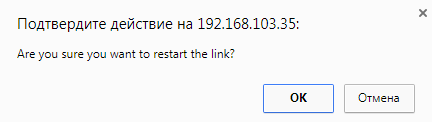
A warning message pops up before the link restart. If the operation is executed, the link disappears from "Device Status" page until it is reestablished again.
| Center | |||||||
|---|---|---|---|---|---|---|---|
|
| Center | |||||||
|---|---|---|---|---|---|---|---|
|
Extended Switch Statistics
The "Extended Switch Statistics" tools allow gathering complete information and enhanced statistics for each group of the unit.
In order to access the "Extended Switch Statistics" tools, click on the row of each switch group or kernel within the "Switch Statistics" section:
| Center | |||||||
|---|---|---|---|---|---|---|---|
|
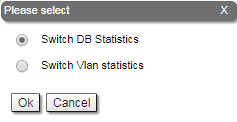
Two options are available: "Switch DB statistics" and "Switch VLAN statistics".
Switch DB Statistics
The "Switch DB Statistics" tool gathers complete information and enhanced statistics for each switch group, including kernel:
| Center | |||||||
|---|---|---|---|---|---|---|---|
|

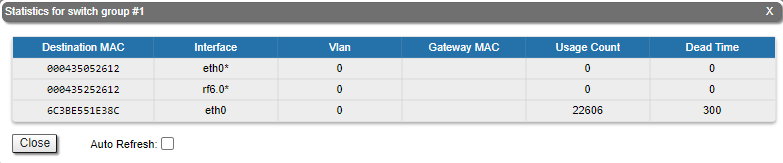
By clicking the «Close» button, you return to the "Device Status" page.
The "Auto Refresh" option is disabled by default. You can enable the auto refresh in order to have the statistics automatically refreshed.
Switch VLAN Statistics
The "Switch VLAN Statistics" tool gathers complete information and enhanced statistics for each VLAN created:
| Center | |||||||
|---|---|---|---|---|---|---|---|
|

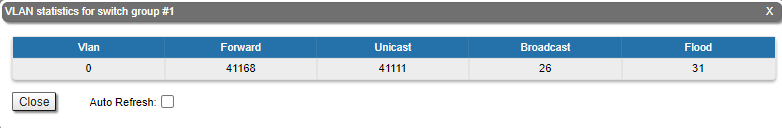
By clicking the «Close» button you return to the "Device Status" page.
The "Auto Refresh" option is disabled by default. You can enable the auto refresh in order to have the statistics automatically refreshed.