...
| Center | |||||
|---|---|---|---|---|---|
|

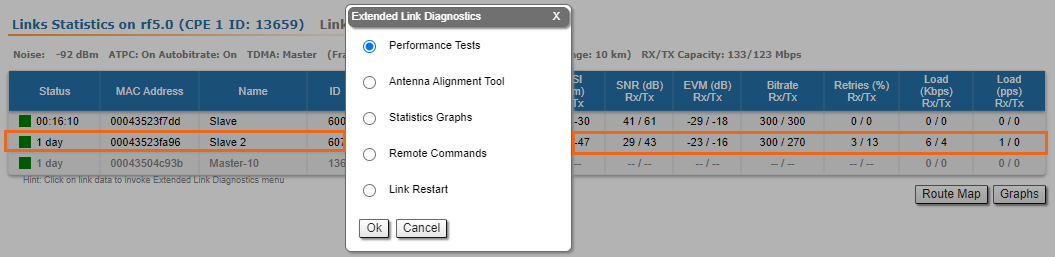
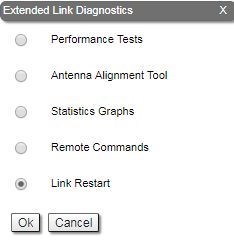
Five options are available: "Performance Tests", "Antenna Alignment Tool", "Statistics Graphs", "Remote Commands" and "Link Restart".
...
Each side of the link (local and remote) has two similar test indicator sets, corresponding to each antenna polarization (one for Vertical polarization and another for Horizontal). This allows controlling the alignment process for each antenna polarization for the local and for the remote device simultaneously.
The text indicators are:
...
Graphical indicator:
| Center | |||||
|---|---|---|---|---|---|
|
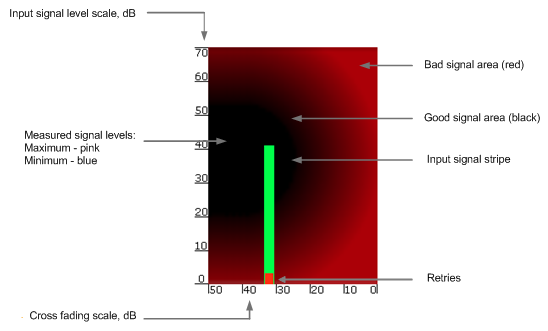
The main indicator is the Input Signal stripe.
The height of the Input Signal stripe is measured in dB by the Input Signal Level scale. The higher the stripe is, the stronger the signal is.
The stripe may change its position along the Cross Fading scale, showing how much influence the corresponding device antenna has (for example: how much vertically and horizontally polarized signals influence each other
...
Graphical indicator:
| Center | |||||
|---|---|---|---|---|---|
|
The main indicator is the Input Signal stripe.
The height of the Input Signal stripe is measured in dB by the Input Signal Level scale. The higher the stripe is, the stronger the signal is.
The ). Higher the value of the stripe according to the Cross Fading scale (the farther stripe is from the 0 dB value), less the influence antennas have on each other.
The top of the Input Signal stripe can be located in black (Good signal) or red (Bad signal) background areas or somewhere in between them. This means the signal is good, bad or average correspondingly. When aligning the antenna, it is recommended to try achieving the stripe top to be located in the black area.
At the bottom of the Input Signal stripe may appear a special red sub-stripe. This sub-stripe indicates the presence of the packet retries and the percentage of the total number of transmitted packets.
During the alignment test, the Input Signal stripe may change its position along the Cross Fading scale , showing how much influence the corresponding device antenna has (for example: how much vertically and horizontally polarized signals influence each other). Higher the value of the stripe according to the Cross Fading scale (the farther stripe is from the 0 dB value), less the influence antennas have on each other.
The top of the Input Signal stripe can be located in black (Good signal) or red (Bad signal) background areas or somewhere in between them. This means the signal is good, bad or average correspondingly. When aligning the antenna, it is recommended to try achieving the stripe top to be located in the black area.
At the bottom of the Input Signal stripe may appear a special red sub-stripe. This sub-stripe indicates the presence of the packet retries and the percentage of the total number of transmitted packets.
During the alignment test, the Input Signal stripe may change its position along the Cross Fading scale and increase or decrease in height, indicating the changes in the received signal. When the top of the stripe changes its location, moving from one point on the background area to another, it leaves pink and blue marks behind, indicating the maximum and minimum measured levels of the signal at a particular point. Thus, it makes possible to observe the “history” of the signal changes.
You can clear the marks by clicking the «Clear History» button at the bottom of the pageand increase or decrease in height, indicating the changes in the received signal. When the top of the stripe changes its location, moving from one point on the background area to another, it leaves pink and blue marks behind, indicating the maximum and minimum measured levels of the signal at a particular point. Thus, it makes possible to observe the “history” of the signal changes.
You can clear the marks by clicking the «Clear History» button at the bottom of the page.
The text indicators are:
- "RSSI" - indicates the power level of the received radio signal (measured in dBm), optimal parameter value -60 ... -40.
- "CINR" - input signal level to noise + interference (measured in dB) indicator, >=28.
- "Crosstalk" - indicates how much vertically and horizontally polarized signals influence each other, >20.
- "Error Vector Magnitude (EVM)" - indicator of the measured input signal quality (it should be as high as possible in absolute value, the recommended level is not less than 21 dB. Some old firmware had EVM value positive, but most the firmware has negative value, so for the troubleshooting, evaluate the absolute EVM value), > 21 in absolute value.
- "Retries" - percentage of transmit packet retries (measured in %), <10.
- "Tx bitrate" - displays the current bitrate for the remote and local units (measured in Kbps).
Main recommendations when using the “Antenna Alignment" tool:
...
The load charts display the actual link load information, either in real time or for a set period of time. The yellow lines represent the total link load, the green lines represent the RX load and the blue lines represent the TX load.
| Center | |||||
|---|---|---|---|---|---|
|
The last chart displays the current CPU load and unit temperature (only for the units equipped with temperature sensors)the green lines represent the RX load and the blue lines represent the TX load.
You can view the six graphs presented above into one or two columns per page or two columns per page by clicking the «Change Layout» button.
Remote Commands
| Anchor | ||||
|---|---|---|---|---|
|
The "Remote Commands" tool allows one MINT node to perform commands on another or all MINT nodes in the network at L2 level using WANFleX OS CLI commands.
Run the string you typed into the “Command” field by clicking the «Change LayoutExecute» button. For the full list and description of WANFleX OS CLI commands, please refer to the WANFleX OS User Manual.
...
The "Remote Commands" tool allows one MINT node to perform commands on another or all MINT nodes in the network at L2 level using WANFleX OS CLI commands.
Run the string you typed into the “Command” field by clicking the «Execute» button. For the full list and description of WANFleX OS CLI commands, please refer to the WANFleX OS User Manual.
You can set the key grant access to the remote node using the “Key” textbox and clicking the «Execute» button. Please note that this key must be prior set at the remote node via CLI (commands "guestKey", "fullKey" - see details in the WanFlex OS User Manual).
Erase the string you typed into the “Command” field and all output from the display section by clicking the «Clear» button.
Stop a command execution during the execution phase by clicking the «Stop Execution» button.
By clicking the «Close» button, you return to the "Device Status" page.
You can choose between plain and rich text format by marking/unmarking the corresponding checkbox.
You can execute the same command from the BS to all CPEs in the network (to the nodes that are linked to the BS) by marking “Send to all” checkbox before clicking the «Execute» button.
You can upload the configuration file to the remote node by clicking the «Upload Config…» button and you can reboot the remote node by clicking the «Reboot Remote Unit» button (a warning message pops up before the reboot).
For the ease of usage of the "Remote Commands" tool, the corresponding buttons for the most used WANFleX OS CLI commands are available in the right side of the screen:
| Center | |||||
|---|---|---|---|---|---|
|
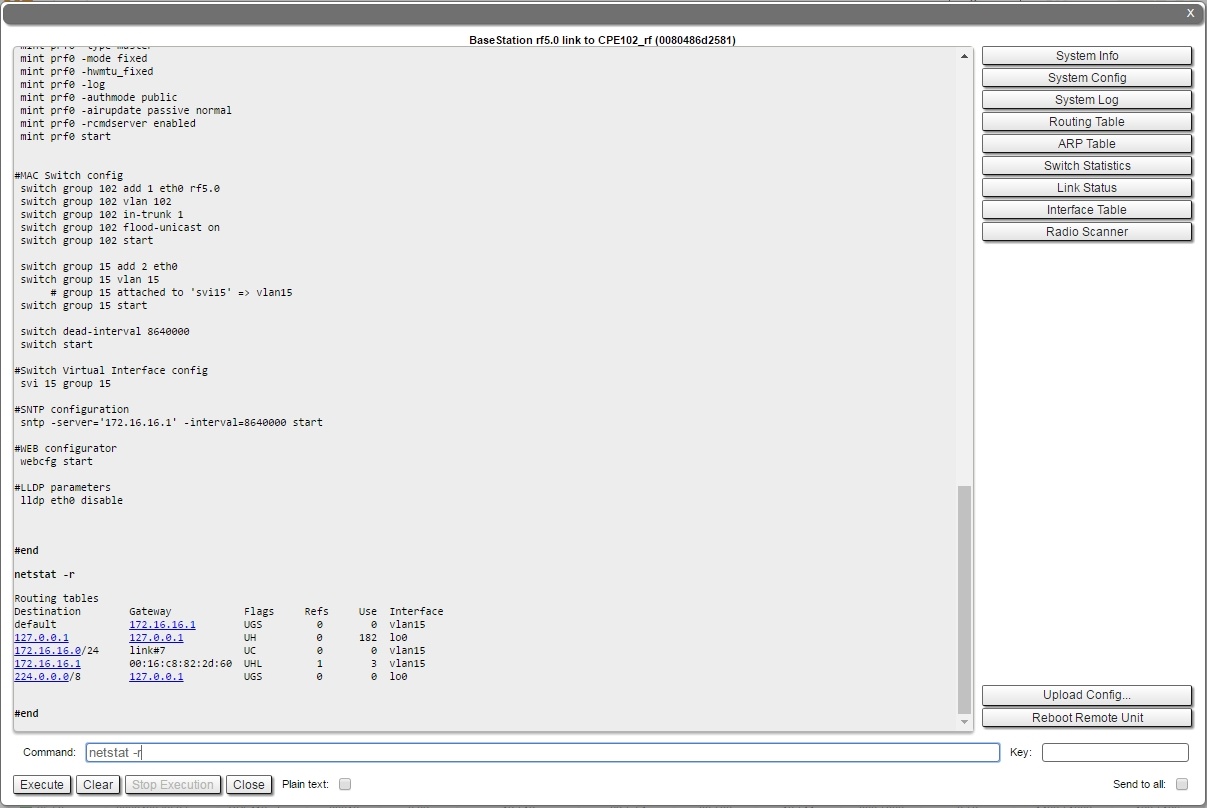
By clicking the «System Info» button, you fill in the command field with "system version, system uptime and system cpu" commands.
By clicking the «System Config» button, you fill in the command field with "system uptime and config show" commands.
By clicking the «System Log» button, you fill in the command field with "system log show" command.
By clicking the «Routing Table» button, you fill in the command field with "netstat -r" command.
By clicking the «ARP Table» button, you fill in the command field with "arp view" command.
By clicking the «Switch Statistics» button, you fill in the command field with "switch statistics" command.
By clicking the «Link Status» button, you fill in the command field with "mint map detail" command.
By clicking the «Interface Table» button, you fill in the command field with "netstat-i" command.
By clicking the «Radio Scanner» button, you fill in the command field with "muffer rf5.0 -t5 -p mac3" command.
All commands are executed automatically after clicking one of the buttons mentioned above.
...
| title | NOTE |
|---|
...
For the ease of usage of the "Remote Commands" tool, the corresponding buttons for the most used WANFleX OS CLI commands are available in the right side of the screen:
| Center | |||||
|---|---|---|---|---|---|
|
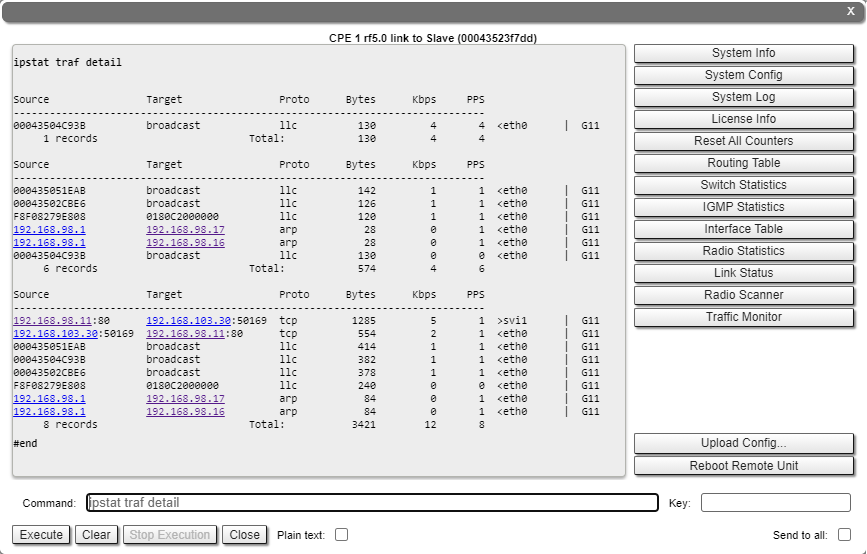
By clicking the «System Info» button, you fill in the command field with "system version, system uptime and system cpu" commands.
By clicking the «System Config» button, you fill in the command field with "system uptime and config show" commands.
By clicking the «System Log» button, you fill in the command field with "system log show" command.
By clicking the «License info» button, you fill in the command field with "license –show" command.
By clicking the «Reset all counters» button, you can reset the device statistics.
By clicking the «Routing Table» button, you fill in the command field with "netstat -r" command.
By clicking the «Switch Statistics» button, you fill in the command field with "switch statistics" command.
By clicking the «IGMP Statistics» button, you fill in the command field with "switch igmp-snooping dump name" command, which displays a list of IGMP hosts (clients) subscribed to a multicast group.
By clicking the «Radio statistics» button, you fill in the command field with "rf radio cap; rf radio stat1 full; muffer stat" commands, which display information about all connections via the radio interface
By clicking the «Link Status» button, you fill in the command field with "mint map detail" command.
By clicking the «Radio Scanner» button, you fill in the command field with "muffer rf5.0 -t5 -p mac3" command, which analyze MAC addresses in order to estimate the number and operation intensity of devices using the same frequency. Analysis duration is 5 seconds..
By clicking the «Traffic Monitor» button, you fill in the command field with "ipstat traf detail" command, which displays the information on data flows traversing the router.
All commands are executed automatically after clicking one of the buttons mentioned above.
| Note | ||
|---|---|---|
| ||
All WANFleX OS CLI commands can be executed from the "Remote Commands" tool. |
You can set the key grant access to the remote node using the “Key” textbox and clicking the «Execute» button. Please note that this key must be prior set at the remote node via CLI (commands "guestKey", "fullKey" - see details in the WanFlex OS User Manual).
Erase the string you typed into the “Command” field and all output from the display section by clicking the «Clear» button.
Stop a command execution during the execution phase by clicking the «Stop Execution» button.
By clicking the «Close» button, you return to the "Device Status" page.
You can choose between plain and rich text format by marking/unmarking the corresponding checkbox.
You can execute the same command from the BS to all CPEs in the network (to the nodes that are linked to the BS) by marking “Send to all” checkbox before clicking the «Execute» button.
You can upload the configuration file to the remote node by clicking the «Upload Config…» button and you can reboot the remote node by clicking the «Reboot Remote Unit» button (a warning message pops up before the reboot).
Link Restart
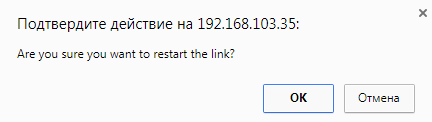
You can restart the wireless link (re-association, re-authentication and re-connection) by selecting the “Link Restart” radio button and then by clicking the «OK» button in the link options.
A warning message pops up before the link restart. If the operation is executed, the link disappears from "Device Status" page until it is reestablished again.
| Center | |||||
|---|---|---|---|---|---|
| |||||
| Center | |||||
|
Extended Switch Statistics
The "Extended Switch Statistics" tools allow gathering complete information and enhanced statistics for each group of the unit.
In order to access the "Extended Switch Statistics" tools, click on the row of each switch group or kernel within the "Switch Statistics" section:
| Center | |||||
|---|---|---|---|---|---|
|
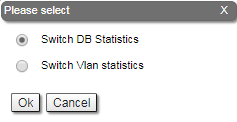
Two options are available: "Switch DB statistics" and "Switch VLAN statistics".
Switch DB Statistics
The "Switch DB Statistics" tool gathers complete information and enhanced statistics for each switch group, including kernel:
| Center | |||||
|---|---|---|---|---|---|
|

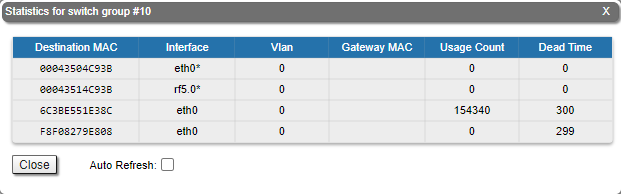
By clicking the «Close» button, you return to the "Device Status" page.
The "Auto Refresh" option is disabled by default. You can enable the auto refresh in order to have the statistics automatically refreshed.
Switch VLAN Statistics
The "Switch VLAN Statistics" tool gathers complete information and enhanced statistics for each VLAN created:
| Center | |||||
|---|---|---|---|---|---|
|

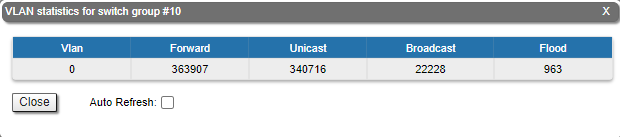
By clicking the «Close» button you return to the "Device Status" page.
The "Auto Refresh" option is disabled by default. You can enable the auto refresh in order to have the statistics automatically refreshed.