...
- Node name and ID
- Noise level
- Number of established links
- ATPC status (activated or deactivated)
- Autobitrate status (activated or deactivated)
- Polling or TDMA mode
| Center |
|---|
| Scroll Table Layout |
|---|
| style | table-layout: fixed; |
|---|
| widths | 20%, 80% |
|---|
|
| Scroll Title |
|---|
| title | Table - Wireless Links Statistics |
|---|
| | Parameter | Description |
|---|
| Status | - Gives a color indication for the wireless connection quality with the neighbor unit:
- Red: poor connection
- Yellow: good connection
- Green: excellent connection
- Remote device's interface role:
- Link Uptime. Displays the link uptime
- F – relevance of remote unit firmware (optional). Idicates that the remote unit has the older firmware than the local one
- ? – system password of the remote unit (optional).Idicates that the remote unit has not the system password
- E – Ethernet port status on the remote device (optional). Indicates that the remote device Ethernet port is flapping
| | MAC Address | - Displays the neighbor’s MAC address
| | Name | - Displays the neighbor’s name
| | Node ID | - Displays the sequential number of the neighboring node
| | Distance | - Displays the calculated (theoretical) distance to the neighbor unit (in Km)
| | Tx Power | - Displays the power level of the Tx and Rx signals of the neighbor unit (in dBm)
| | SNR | - Displays the ratio of the useful signal power to the noise power for the input and output signals at the neighbor unit (in dB). For radio link stable operation, the SNR value must in the range of 12-50 dB, higher modulation are available at values of 27-50 dB
| | Current Level | - Displays the Tx and Rx signals levels for current bitrate of the neighbor unit (in dB)
| | Bitrate | - Displays the set bitrate value for the Tx and Rx signals of the neighbor unit
| | Retries | - Displays the percentage of Tx and Rx retries of the neighbor unit
| | Errors | - Displays the percentage of Tx and Rx errors of the neighbor unit
| | Load | - Displays the number of kbps and packets that are going inbound and outbound the radio interface of the neighbor unit (main data)
|
|
|
...
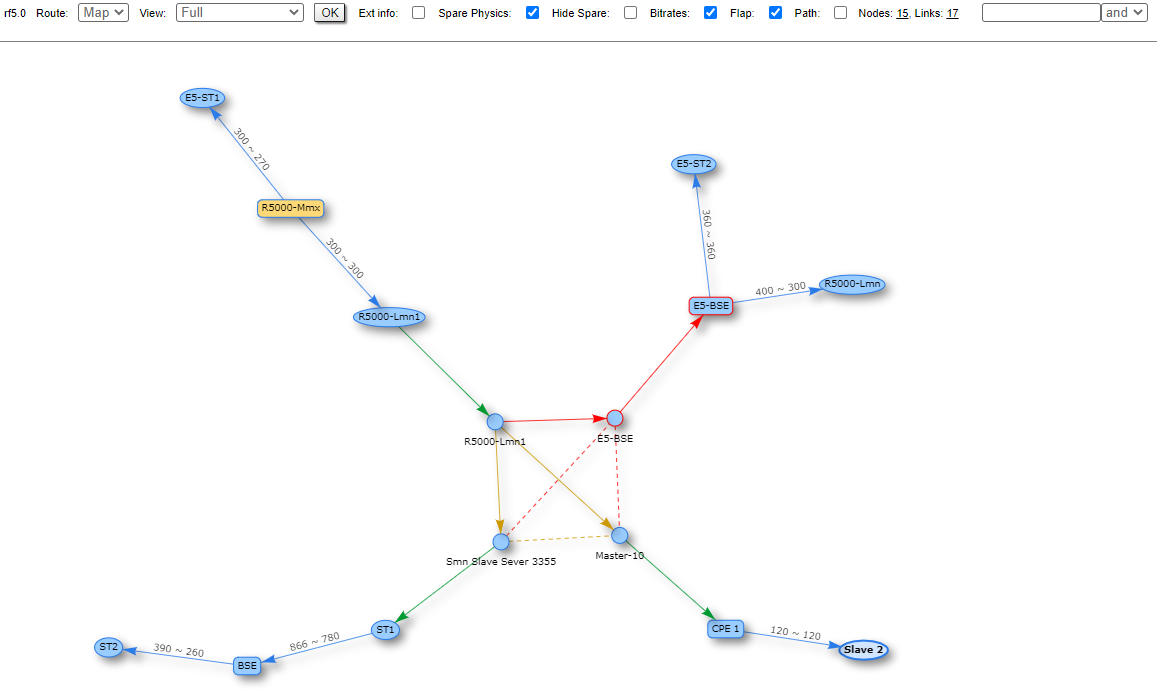
Schematic topology map allows you to visually determine the network connectivity and complexity and to track the route switching, including mobile objectsand to track the route switching, including mobile objects.
The radio interfaces of the Masters devices are marked with a rectangle, the Slaves are marked with ellipses. The device name highlighted in red indicates problems in its operation. Connections are represented by arrows pointing the prevailing direction of data transfer. Arrows have the following color differences:
- Blue - wireless connection, thicker the line, the higher a load on the link.
- Yellow - PRF connection.
- Green - join connection between radio and prf interfaces.
- Red - indicates the interruptions of the link.
Dashed lines represent backup routes.
| Center |
|---|
| Scroll Title |
|---|
| title | Figure - Schematic map |
|---|
| 
|
|
...
| Center |
|---|
| Scroll Title |
|---|
| title | Figure - Errors/Drops Statistics |
|---|
|  Image Removed Image Removed | 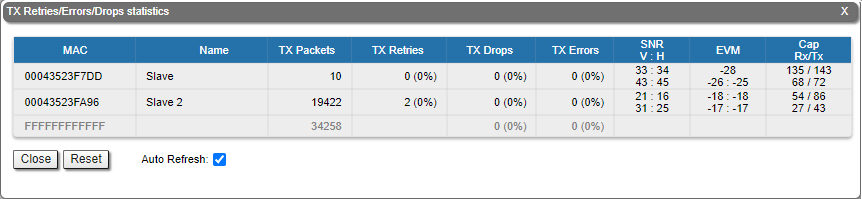 Image Added Image Added
|
|
The EVM value is measured not at the operation modulation, but at the lowest possible. In case the misoctl option is enabled and VBR is disabled on Slave, the lowest possible modulation uses a single data stream. If misoctl is turned off or VBR is turned on, both channels will be used for transmission, and the EVM parameter values will be displayed for each modulation.
By clicking the «Close» button, you return to the "Device Status" page.
...