...
- "CPU load" - displays the load percentage of the CPU
- "Memory load":
- Memory (the data stored in volatile memory are valid only during the current session, until the system reset) displays in real-time the total memory available and the used memory by the running processes
- Flash memory (non-volatile memory) displays in real-time the total memory available and the used memory by the WANFleX and configuration files
- "Interface Statistics" - displays the main parameters of all configured interfaces (physical and logical)
- "Wireless Links Statistics" - displays the main parameters of all wireless connections between the device and the neighbor devices
- "Switch Statistics" - displays counters of the frames which have been switched (for example: the number of dropped packets and if they are dropped because of the flood into their reachable destination, because of the STP, because of the firewall, etc).
...
| Center |
|---|
| Scroll Title |
|---|
| title | Table - Interface Statistics |
|---|
| | Parameter | Description |
|---|
Interface | - Displays all physical and configured logical set interfaces
| | MAC Address | - Displays the MAC address of each interface
| | Status | - Displays for each interface whether it is “up and running” or notstatus of each interface:
- Up - enabled;
- Down - disabled.
| | Mode | - Displays the operation mode of each interface.
- Ethernet interface:
- 10,100 or 1000 Mbps;
- Half or full duplex mode - red value of this parameter informs that transmission is performed in a half-duplex mode.
- Radio interface:
- Bitrate;
- Operating frequency - red value of this parameter indicates an absence of data transmission due to the spectrum scanning by the DFS tool;
- Channel width;
- TX Power - red value for this parameter may indicate a problem with the transceiver's hardware.;
- DFS tool state;
- Greenfield mode.
- SVI:
- PRF interface:
- Parent;
- Channel number;
- Frame size - red value of this parameter means impossibility to set the optimal size due to external limitation (MTU value on the switch port).
- Vlan interface:
- Parent;
- Vlan ID;
- Selected vlan interface operation standard.
| | Packets | - Displays the number of received and transmitted packets for each interface since the unit is operational. The local system packets are counted, too (and not only the ones that are passing through the switching groups - data traffic)
| | Errors | - Displays the number of received and transmitted error packets for each interface since the unit is operational
| | Load | - Displays the packet flow through each interface in real-time (for the system and the data traffic)
|
|
|
...
| Center |
|---|
| Scroll Title |
|---|
| title | Figure - Schematic map |
|---|
| 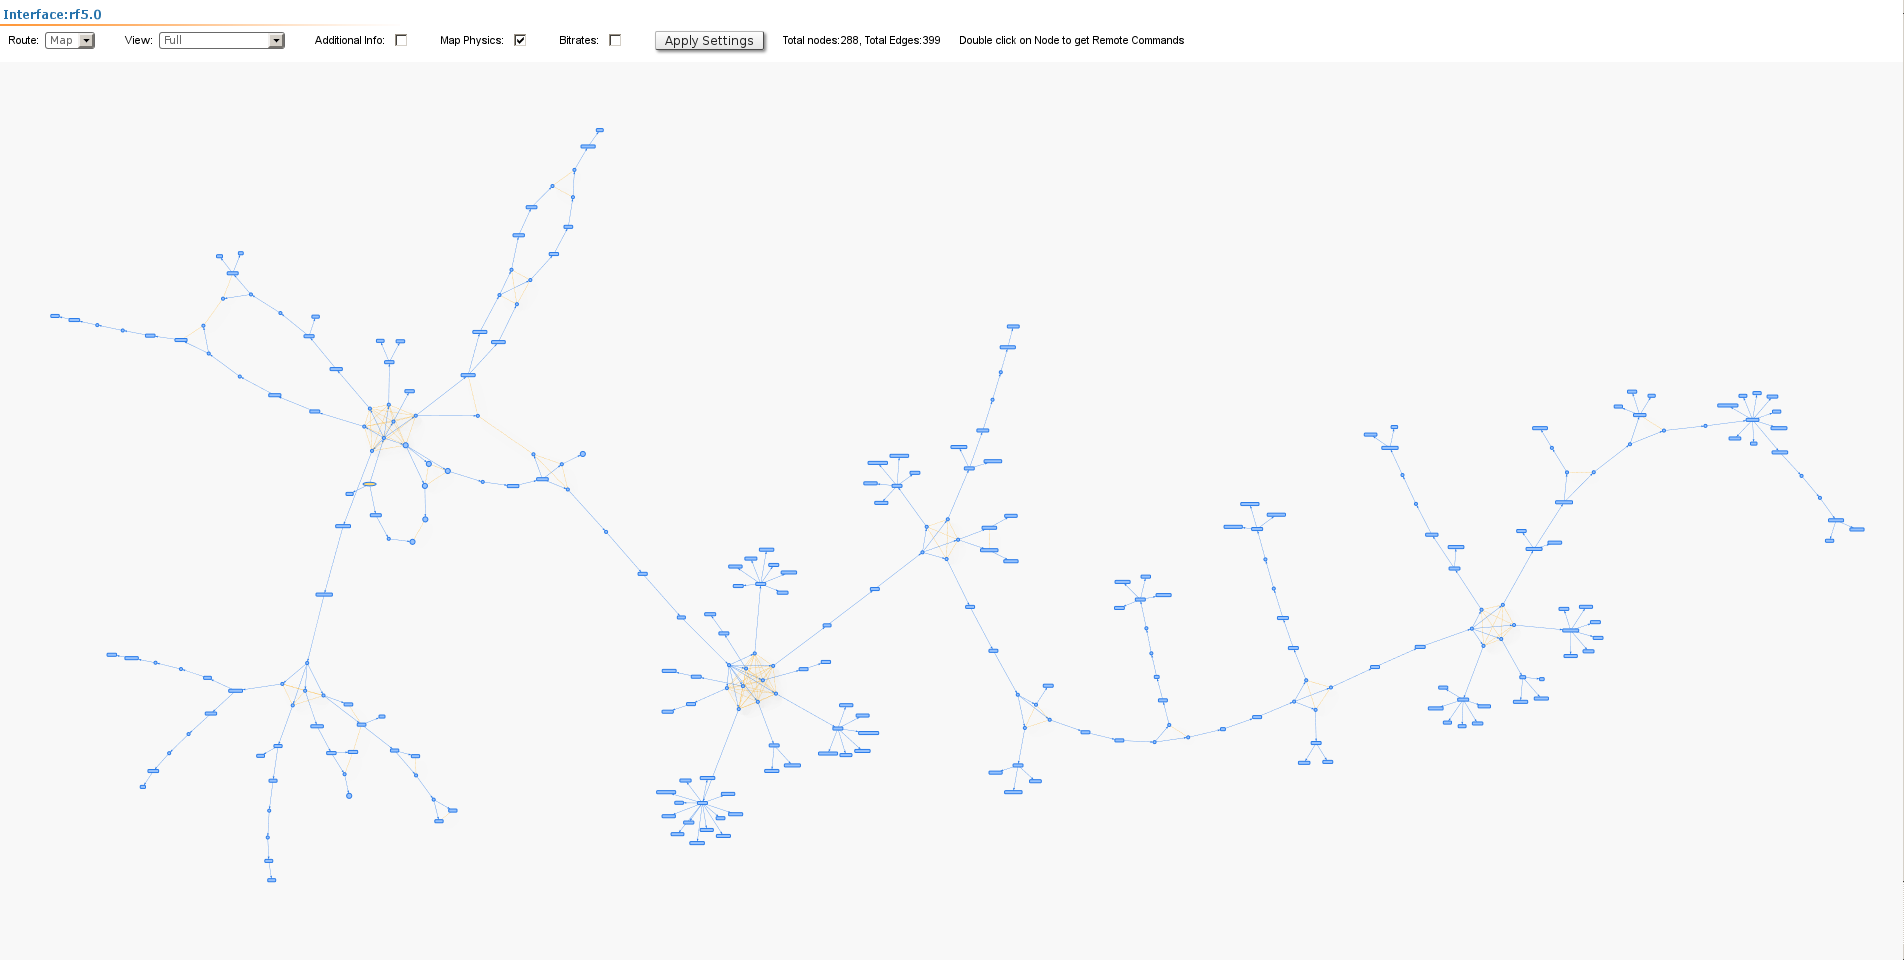 Image Removed Image Removed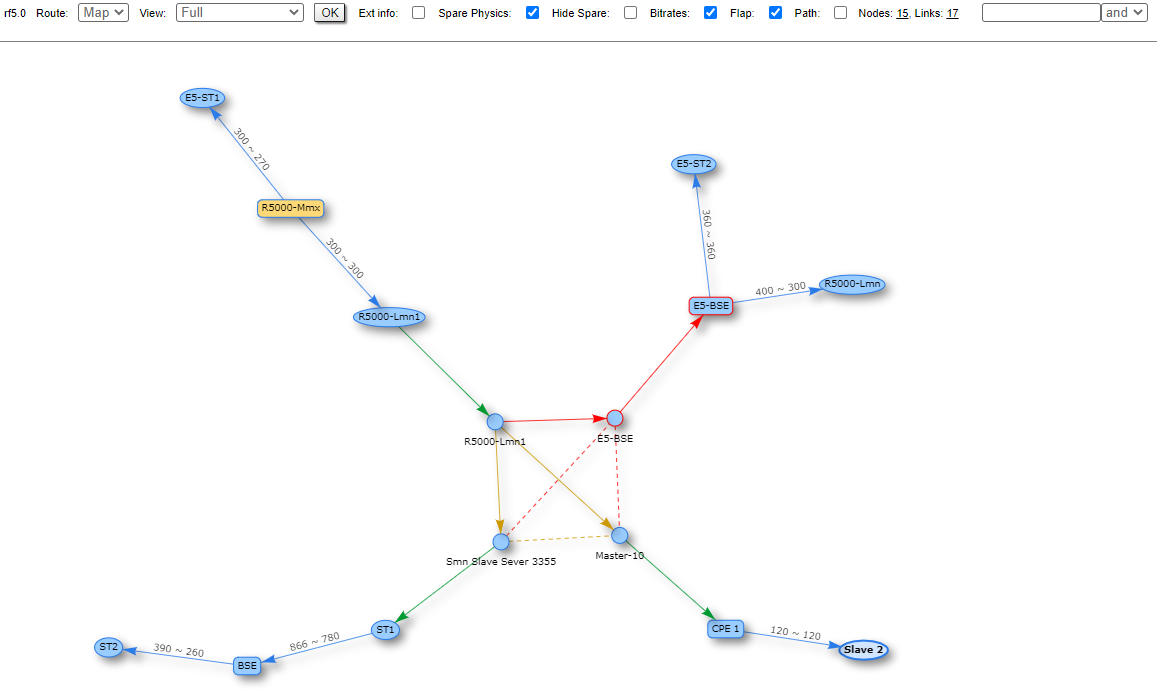 Image Added Image Added
|
|
For additional information on each node, double click on it to get remote commands (rcmd).
...
| Center |
|---|
| Scroll Title |
|---|
| title | Figure - Wireless Links Statistics for the Radio interface in the TDMA based software |
|---|
|  Image Removed Image Removed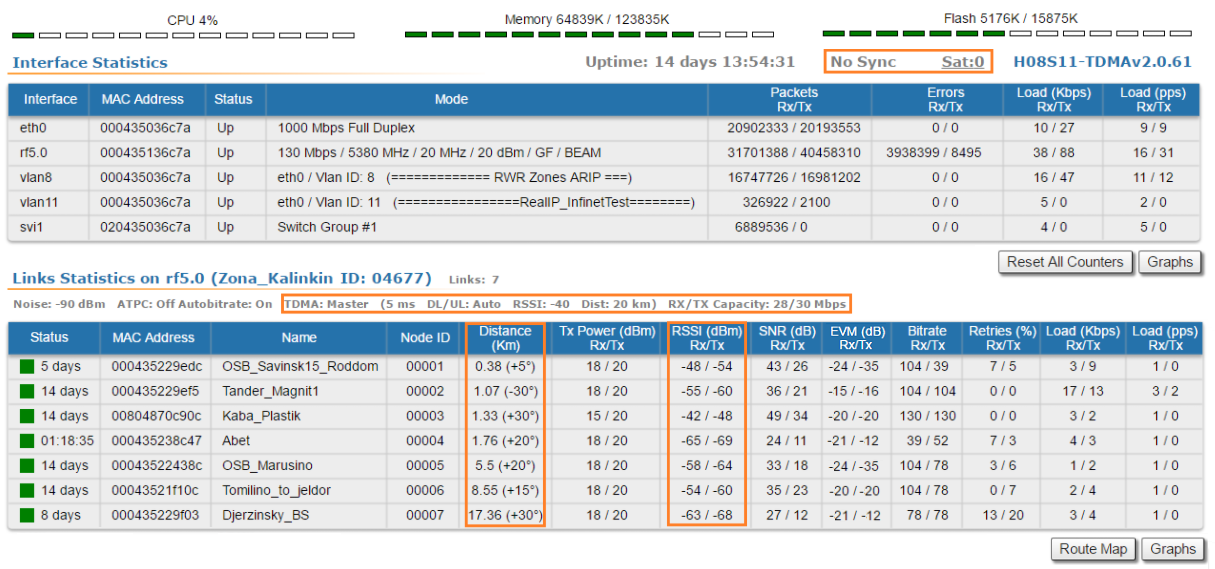 Image Added Image Added
|
|
| Center |
|---|
| Scroll Title |
|---|
| title | Table - Wireless Links Statistics - Radio particular parameters in the TDMA based software |
|---|
| | Parameter | Description |
|---|
| Current TDMA parameters | - Displays the current TDMA parameters:Operational mode of the unit (Master/Slave)
- Displays the current TDMA parameters for Master:
- Time slot duration (in microseconds)
- Downlink percentage of the time slot
- Maximum RSSI level (in dBm)
- Maximum operational distance (in kilometers)
- RX/TX Capacity
| | RSSI (dBm) Rx/Tx | - Displays the power present in a received radio signal
- "Rx" – the power of received radio signal, measured at the local unit
- "Tx" – the power of received radio signal, measured at the remote unit
- "*" – indicates the difference in the signals power of the vertical and horizontal polarizations
| | - Displays the current status of device synchronization with external timing reference from GPS/GLONASS
- "Sync": the device is in sync. The value in brackets is current value of the offset (in microseconds) between the internal clock of the device and the external timing reference from GPS/GLONASS
- "Wait Sync": the device is waiting the external timing reference from GPS/GLONASS. Synchronization is enabled on the device, but it doesn’t receive external timing reference from GPS/GLONASS
- "No Sync": the device is not in sync. The current value of offset between the internal clock and the external timing reference from GPS/GLONASS is beyond the allowed value range (±10 microseconds)
| | Sat: | - The number of visible GPS/GLONASS satellites
|
|
|
...
| Center |
|---|
| Scroll Title |
|---|
| title | Figure - Switch Statistics |
|---|
|  Image Removed Image Removed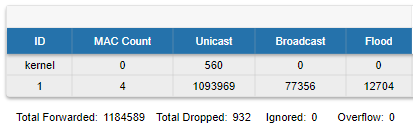 Image Added Image Added
|
|
It also displays the number of dropped packets for: STP, unreachable destination, firewall, possible loop, discard, MAC limits and reverse, within each Switch group and kernel, in real-time (since the last reboot):
| Center |
|---|
| Scroll Title |
|---|
| title | Figure - Switch Statistics |
|---|
| Image Removed |
|
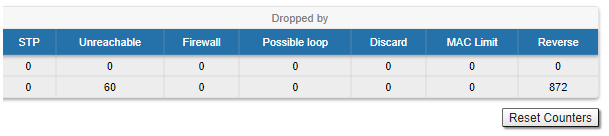 Image Added Image Added
|
Total forwarded, dropped and ignored packets are displayed in real-time, too.
...
| Center |
|---|
| Scroll Title |
|---|
| title | Figure - Extended Interface Statistics |
|---|
| 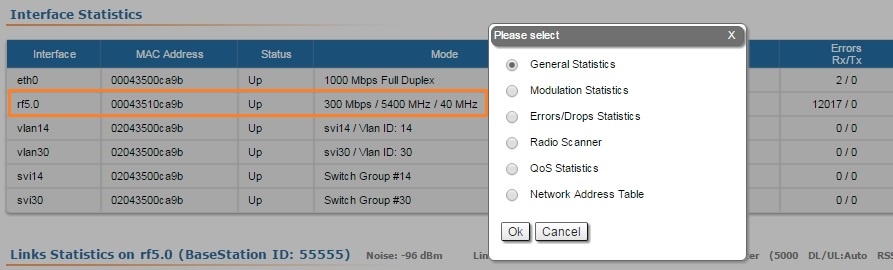 Image Removed Image Removed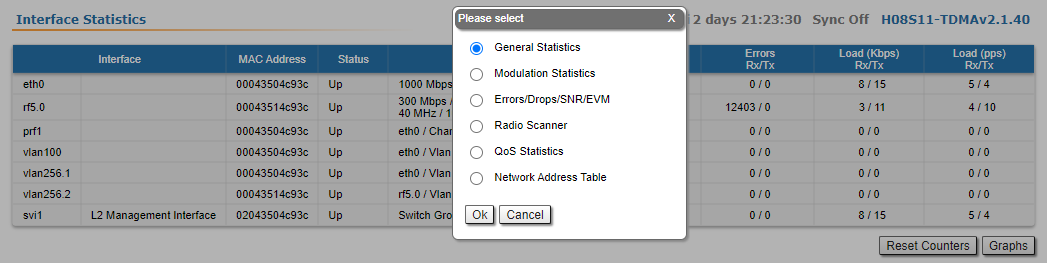 Image Added Image Added
|
|
...
| Center |
|---|
| Scroll Title |
|---|
| title | Figure - General Statistics Ethernet |
|---|
| 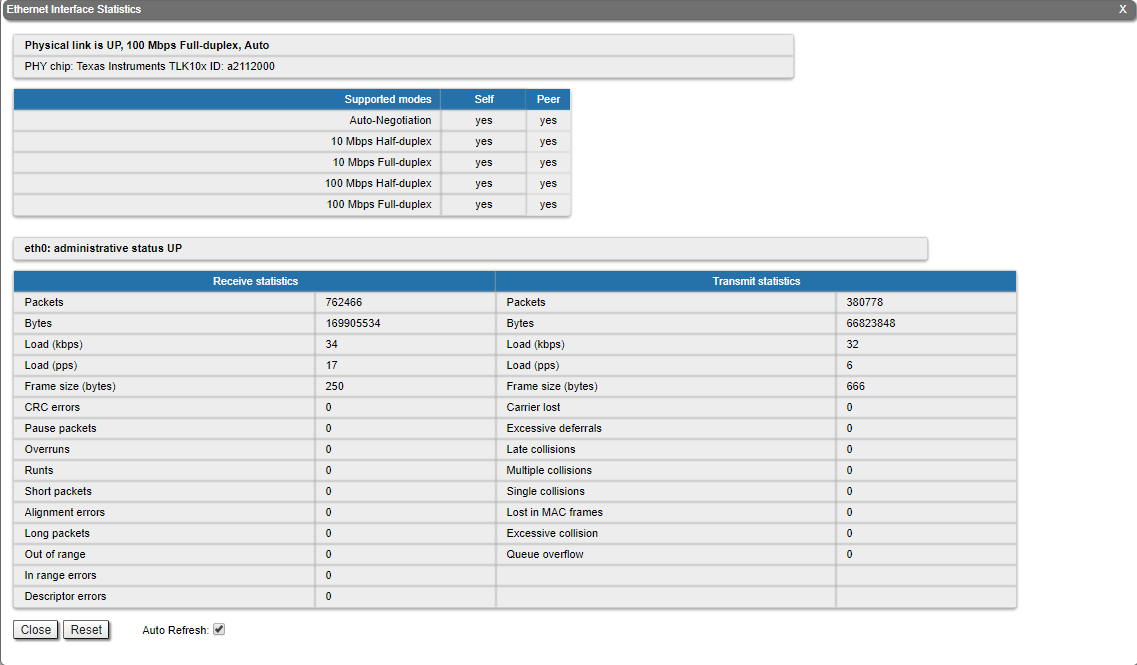 Image Removed Image Removed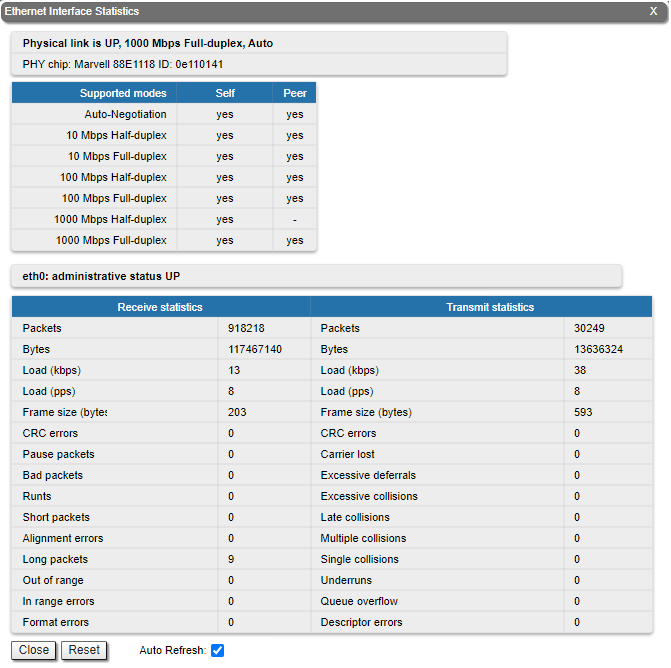 Image Added Image Added
|
|
Rx and Tx statistics parameters:
| Center |
|---|
| Parameter | Description |
|---|
| Receive statistics | | Packets | The total number of received packets | | Bytes | The sum of lengths of all good Ethernet frames received | | Load (kbps) | The link load, Kbit/s | | Load (pps) | The link load, packets per second | | Frame size (bytes) | The frame size in bytes | CRC errors | Total frames received with a CRC error | Pause packets | The number of good frames received that have a Pause destination MAC address | | Overruns | Packets dropped due to queue overflow | Runts | Total frames received with a length of less than 64 octets and an invalid FCS | Short packets | Total frames received with a length of less than 64 octets but with a valid FCS | | Alignment errors | Number of frames received with bad number of octets and bad CRC | Long packets | Total frames received with a length of more than MaxSize octets but with a valid FCS | Transmit statistics | Packets | The total number of transmitted packets | Bytes | The sum of lengths of all good Ethernet frames sent | | Load (kbps) | The link load, Kbit/s | | Load (pps) | The link load, packets per second | | Frame size (bytes) | The frame size in bytes | | Excessive deferrals | The total number frames of packets that are were delayed because due to the medium was busybusy transmission medium | CRC errors | Total frames received with a CRC error | Late collisions | The number of times a collision is detected later than 512 bits-times into the transmission of a frame | Multiple collisions | The total number of successfully transmitted frames that experienced more than one collision | Single collisions | The total number of successfully transmitted frames that experienced exactly one collision | Excessive collisions | The total number of frames dropped after 16 attempts to send ended with collision | | Queue overflow | Packets dropped due to queue overflow |
|
For the radio interface information about current status, DFS mode and load statistics is available.
| Center |
|---|
| Scroll Title |
|---|
| title | Figure - General Statistics RF |
|---|
| 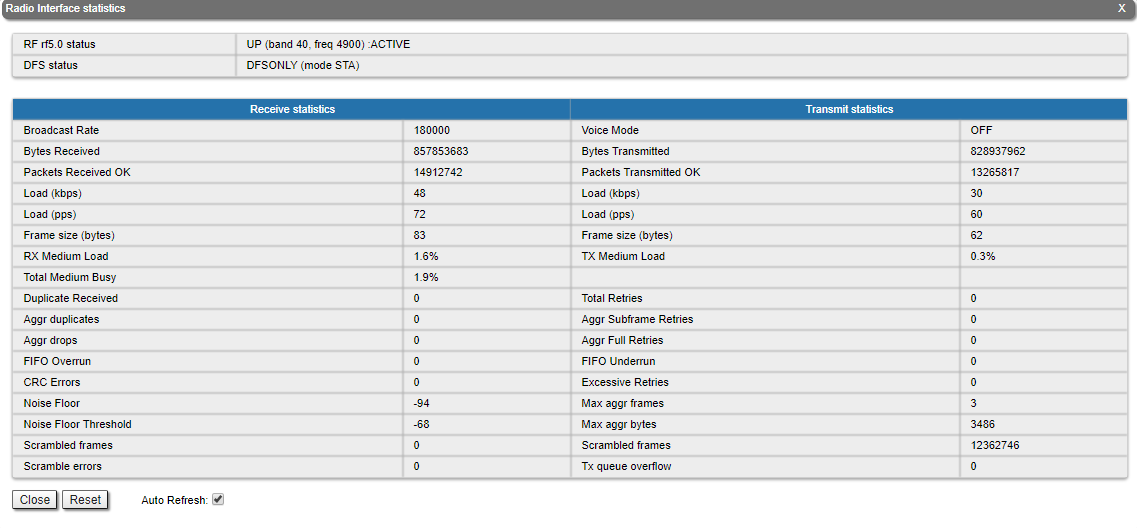 Image Removed Image Removed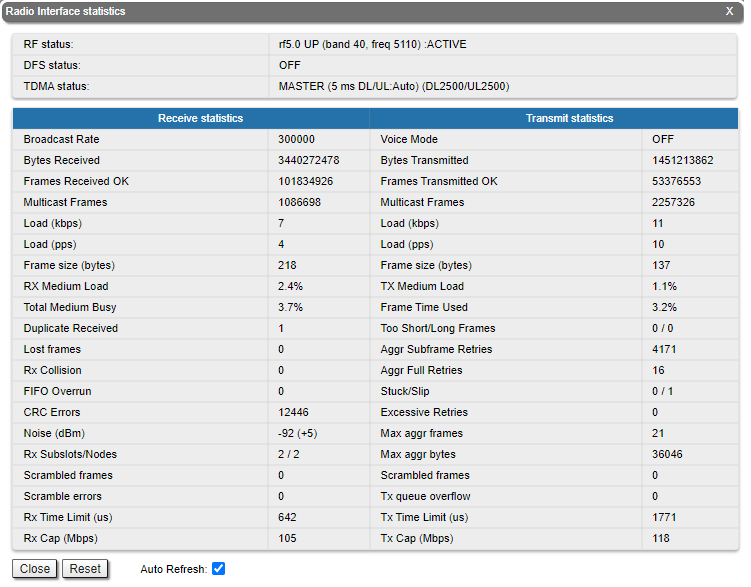 Image Added Image Added
|
|
Rx and Tx statistics parameters:
...
| Center |
|---|
| Scroll Title |
|---|
| title | Figure - General Statistics SVI |
|---|
| 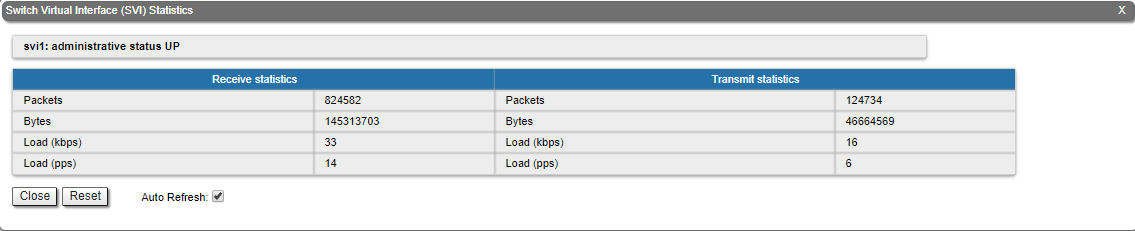 Image Removed Image Removed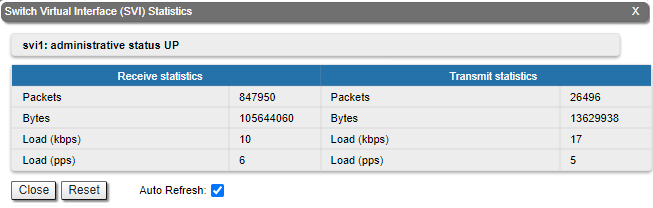 Image Added Image Added
|
|
By clicking the «Close» button, you return to the "Device Status" page.
...
The "Auto Refresh" option is active by default and refreshes the statistics automatically. You can disable the auto refresh.
The The "Errors/Drops Statistics/SNR/EVM" tool window displays the number of errors, retries and droped packets during transmission for each link. In . This tool provides information about the SNR level for each polarization of the remote and local devices. In addition, this section displays the estimated throughput per throughput per subscriber in Mbps. The "Cap min" parameter shows lower values show the guaranteed throughput in throughput in the worst case scenario when all subscribers are actively transmitting. The "Cap max" parameter displays The upper values display the throughput in the best scenario, when data is transmitted only by the selected subscriber.
| Center |
|---|
| Scroll Title |
|---|
| title | Figure - Errors/Drops Statistics |
|---|
|  Image Removed Image Removed Image Added Image Added
|
|
By clicking the «Close» button, you return to the "Device Status" page.
...