...
The software version is displayed in the right side of Interface Statistics section (for example: MINTv1.90.5).
...
Links Statistics on rf5.0
This section displays the following information for the radio interface of the unit:
...
| Center | |||||||||||||||||||||||||||||||||||||
|---|---|---|---|---|---|---|---|---|---|---|---|---|---|---|---|---|---|---|---|---|---|---|---|---|---|---|---|---|---|---|---|---|---|---|---|---|---|
|
In TDMA based software, some additional information about wireless link parameters is available in the "Wireless Links Statistics for Interface rf5.0" section:
...
| title | Figure - Wireless Links Statistics for the Radio interface in the TDMA based software |
|---|
...
By clicking the "Route Map" button you can get the MINT topology schematic map with the visualization of the active and alternative routes to each node.
| Note | ||
|---|---|---|
| ||
Map is available for H08, H09, H11 hardware platforms. |
Schematic topology map allows you to visually determine the network connectivity and complexity and to track the route switching, including mobile objects.
| Center | ||||||||||||||||||
|---|---|---|---|---|---|---|---|---|---|---|---|---|---|---|---|---|---|---|
Parameter | Description | Current TDMA parameters | RSSI (dBm) Rx/Tx |
Sync Status | Displays the current status of device synchronization with external timing reference from GPS/GLONASS
|
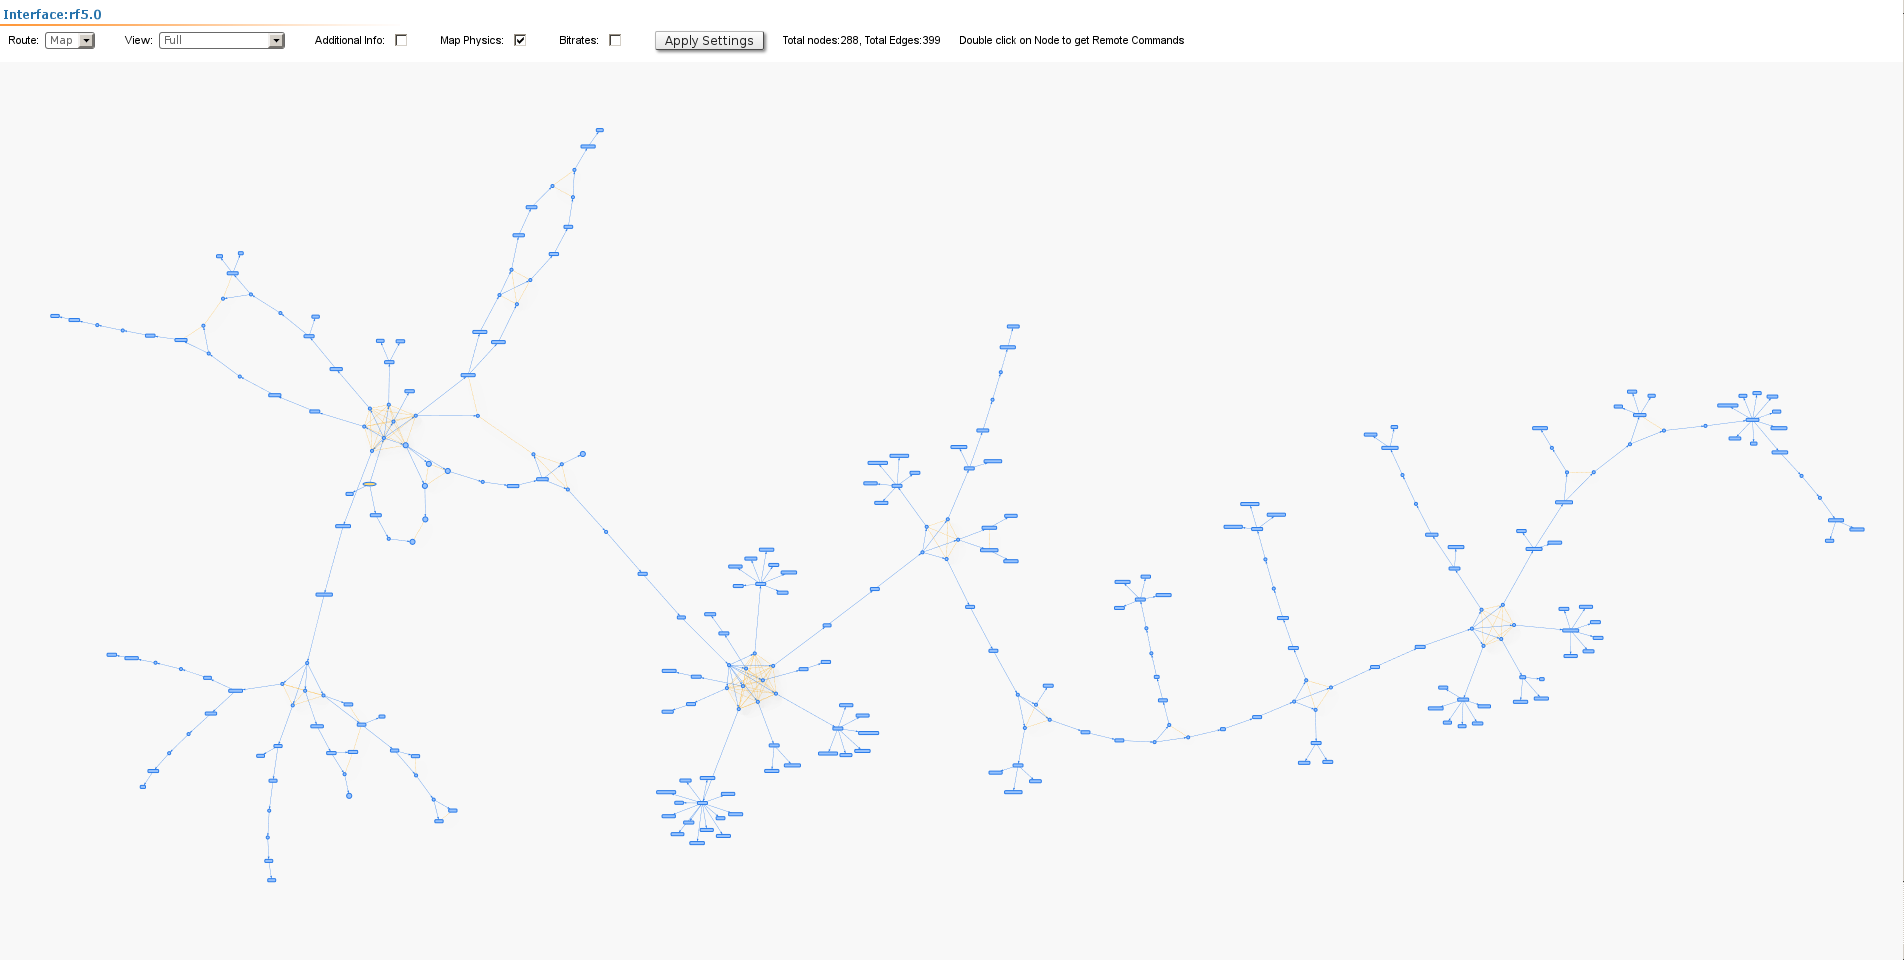
For additional information on each node, double click on it to get remote commands (rcmd).
| Center | |||||
|---|---|---|---|---|---|
|
Detailed information about options in this tool is described in the "Remote Commands" section.
In TDMA based software, some additional information about wireless link parameters is available in the "Wireless Links Statistics for Interface rf5.0" section:
| Center | |||||
|---|---|---|---|---|---|
|
| Center | |||||||||||||||||||
|---|---|---|---|---|---|---|---|---|---|---|---|---|---|---|---|---|---|---|---|
|
...
| Center | |||||
|---|---|---|---|---|---|
|
It also displays the number of dropped packets for: STP, unreachable destination, firewall, possible loop, discard, MAC limits and reverse, within each Switch group and kernel, in real-time (since the last reboot):
| Center | |||||
|---|---|---|---|---|---|
|
Total forwarded, dropped and ignored packets are displayed in real-time, too.
...
| Center | |||||||||||||||||||||||||||
|---|---|---|---|---|---|---|---|---|---|---|---|---|---|---|---|---|---|---|---|---|---|---|---|---|---|---|---|
|
...
|
By clicking the «Show System Log» button, you can view the "System Log" section:
| Center | |||||
|---|---|---|---|---|---|
|

The "System Log" section allows browsing the unit’s system log. It is possible to minimize/enlarge the system log window by clicking the buttons:
You can delete all the information saved in the system log by clicking the «Clear System Log» button. You can hide the System Log section by clicking the «Hide System Log» button.
Extended Interface Statistics
The "Extended Interface Statistics" tools gather complete information and enhanced statistics for each interface of the unit. Each interface type has its own set of available tools applicable to it.
In order to access the "Extended Interface Statistics" tools, click on the row of each interface within the "Interface Statistics" section:
| Center | |||||
|---|---|---|---|---|---|
|

General Statistics
The "General Statistics" tool displays the information about the interface such as the interface mode, current status, Rx and Tx statistics, etc. The actual statistics details depend on the interface type.
By clicking the «Close» button, you return to the "Device Status" page.
By clicking the «Reset» button, you clear all counters displayed in the page.
The "Auto Refresh" option is active by default and refreshes the statistics automatically. You can disable the auto refresh.
| Center | |||||
|---|---|---|---|---|---|
|
The "System Log" section allows browsing the unit’s system log. It is possible to minimize/enlarge the system log window by clicking the buttons:
You can delete all the information saved in the system log by clicking the «Clear System Log» button. You can hide the System Log section by clicking the «Hide System Log» button.
Extended Interface Statistics
The "Extended Interface Statistics" tools gather complete information and enhanced statistics for each interface of the unit. Each interface type has its own set of available tools applicable to it.
...
|

Modulation Statistics
The "Modulation Statistics" tool displays the information about modulation types, such as receive and transmit statistics for different coding scheme.
| Center | |||||
|---|---|---|---|---|---|
|

By clicking the «Close» button, you return to the "Device Status" page.
By clicking the «Reset» button, you clear all counters displayed in the page.
The "Auto Refresh" option is active by default and refreshes the statistics automatically. You can disable the auto refresh.
Errors/Drops Statistics
The "Errors/Drops Statistics" tool displays the number of errors and link drops during transmission for each link.
| Center | |||||
|---|---|---|---|---|---|
|
General Statistics
The "General Statistics" tool displays the information about the interface such as the interface mode, current status, Rx and Tx statistics, etc. The actual statistics details depend on the interface type.
|

By clicking the «Close» button, you return to the "Device Status" page.
...
The "Auto Refresh" option is active by default and refreshes the statistics automatically. You can disable the auto refresh.
| Center | |||||
|---|---|---|---|---|---|
|
...
Radio Scanner
The "Radio Sources AnalysisScanner" tool allows to estimate the efficiency of the radio links utilization, analyzing the radio-frequency environment for the current frequency, under the current channel bandwidth, without the radio link interruption and displays the following statistics:
...
| Center | |||||
|---|---|---|---|---|---|
|

The abbreviations for each node type are also displayed in the interface:
...
The "Auto Refresh" option is active by default and refreshes the statistics automatically. You can disable the auto refresh.
QoS
...
Statistics
QoS (Quality of Service) characterizes the entire network performance which is defined by the parameters such as: throughput, latency, jitter, error rate, available bandwidth, etc. In order to provide the guaranteed Quality of Service for certain applications, users or data flows, different prioritization methods are used.
The "QoS statistics Statistics" tool displays the statistics of the MINT priority queues for the interface.
...
| Center | |||||
|---|---|---|---|---|---|
|

By clicking the «Close» button, you return to the "Device Status" page.
By clicking the «Reset» button, you clear all counters displayed in the in the page.
The "Auto Refresh" option is active by default and refreshes the statistics automatically. You can disable the auto refresh.
Network Address Table
The "Network Address Table" tool shows the network address table for the interface.
| Center | |||||
|---|---|---|---|---|---|
|

By clicking the «Close» button, you return to the "Device Status" page.
The "Auto Refresh" option is active by default and refreshes the statistics automatically. You can disable the auto refresh.
...
LLDP Information
The "Network Address TableLLDP Information" tool shows the network address table for the interfaceallows to get information on the link layer discovery protocol.
| Center | |||||
|---|---|---|---|---|---|
|
| Center | |||||
|---|---|---|---|---|---|
|
|

By clicking the «Close» button, you return to the "Device Status" page.
The "Auto Refresh" option is active by default and refreshes the statistics automatically. You can disable the auto refresh.
Extended Link
...
Diagnostics
Once a wireless connection between the unit and the remote neighbor is established, it is possible to make extended diagnostics and optimization for the wireless link.
In order to access the "Extended Link DiagnosticDiagnostics" tools, click on the row of each wireless link within the "Wireless Links Statistics for Interfaceon rf5.0" section:
| Center | |||||
|---|---|---|---|---|---|
|

Five options are available: "Performance Tests", "Antenna Alignment Tool", "Statistics Graphs", "Remote Commands" and "Link Restart".
...
| Center | |||||
|---|---|---|---|---|---|
|

By clicking the «Run Tests»/«Stop Tests» buttons at the bottom of the page, you can start/stop the performance tests.
...
- “Test time” parameter - allows setting the duration (in seconds) of the test for each bitrate (5s by default)
- “Bi-directionalBidirectional” check-box - allows choosing between bi-directional (when checked) and unidirectional (when unchecked) performance test“Use mint” check-box - allows performing MINT-enabled test when all the traffic and link parameters are controlled and managed by MINT functions such as ATPC and auto-bitrate, which provide best throughput and minimal number of retries (the statistics for errors and retries are not available in this mode because the errors and retries are already taken into account in the throughput results, at the optimal bitrate).and unidirectional (when unchecked) performance test
| Note | ||
|---|---|---|
| ||
The performance test with “Use MINT” option is very useful in case you want option allows to get estimation about the best wireless link throughput (excluding the information about the bitrate, retries level, etc.), is activated by default. |
- "Priority (0-16)" - By default, it is 16, which is lower than the data traffic that has priority 15. You can increase the test priority by setting a lower value.
The bitrates list on the "Performance test" tool consists of the bitrates that correspond to the channel bandwidth set on the unit (5/10/20/40MHz). To perform the tests for the bitrates related to the other channel bandwidth, you need to reconfigure the channel bandwidth (the “Channel Width” parameter in the "Radio Setting" section of the "Basic Settings" page) on both units within the tested link.
Examples given:
Bi-directional performance test output description for 180 Mbps bitrate (40 MHz channel bandwidth):
| Center | ||||
|---|---|---|---|---|
|
...
|
...
| Center | |||||
|---|---|---|---|---|---|
|
In order to see detailed information about throughput, errors and retries, you can move the mouse cursor over the indication strip of the required bitrate.
Antenna
...
Alignment Tool
The "Graphical antenna alignment" tool Antenna Alignment Tool" allows to visualize the signal characteristics on both sides of the link in order to make the antenna alignment process more accurate and easier.
...
| Center | |||||
|---|---|---|---|---|---|
|

By clicking the «Start Test»/«Stop Test» buttons at the bottom of the page, you can start/stop the alignment test.
...
| Center | |||||
|---|---|---|---|---|---|
|

The main indicator is the Input Signal stripe.
...
| Center | |||||
|---|---|---|---|---|---|
|

- Bad link sample
...
| Center | |||||
|---|---|---|---|---|---|
|
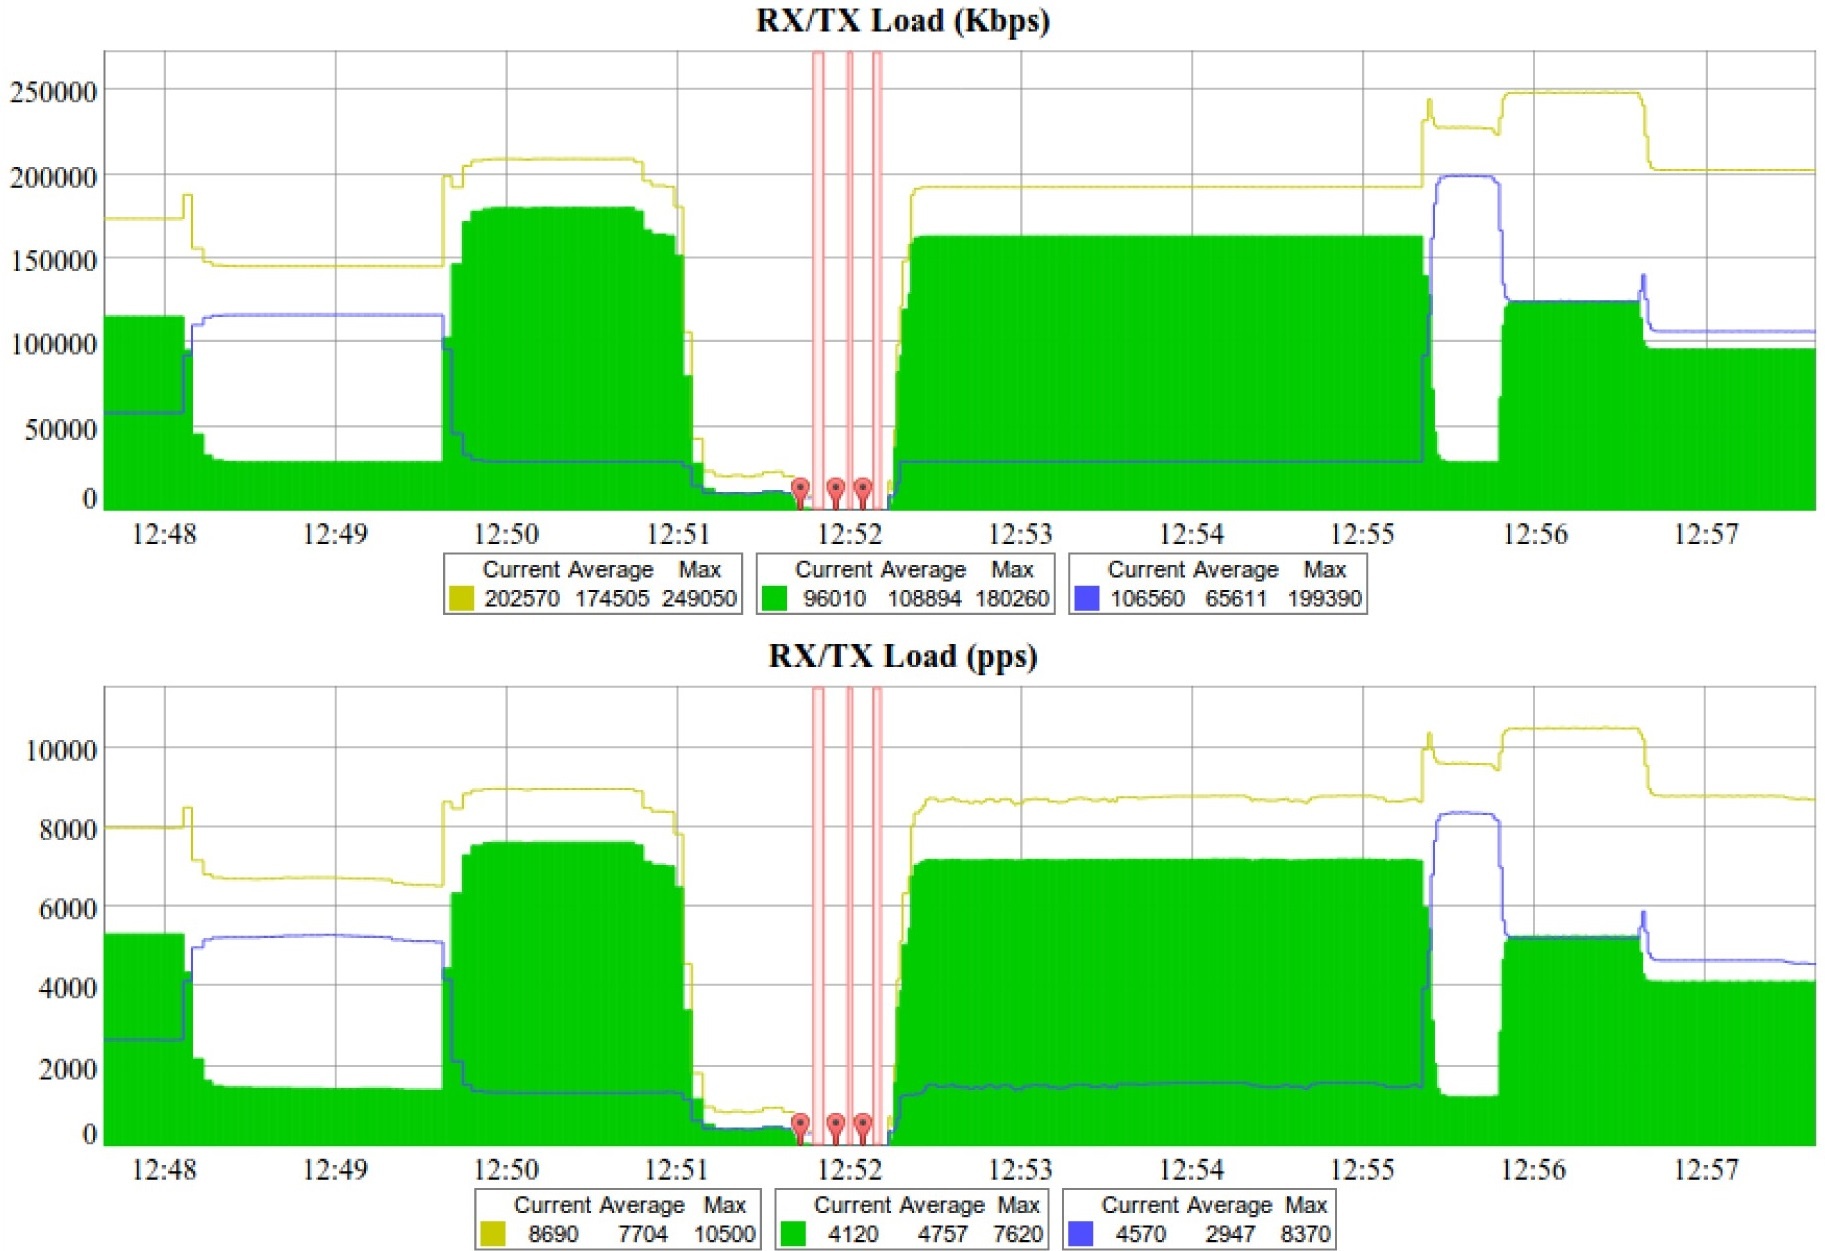
The load charts display the actual link load information, either in real time or for a set period of time. The yellow lines represent the total link load, the green lines represent the RX load and the blue lines represent the TX load.
...
You can view the six graphs presented above into one or two columns per page by clicking the «Change Layout» button.
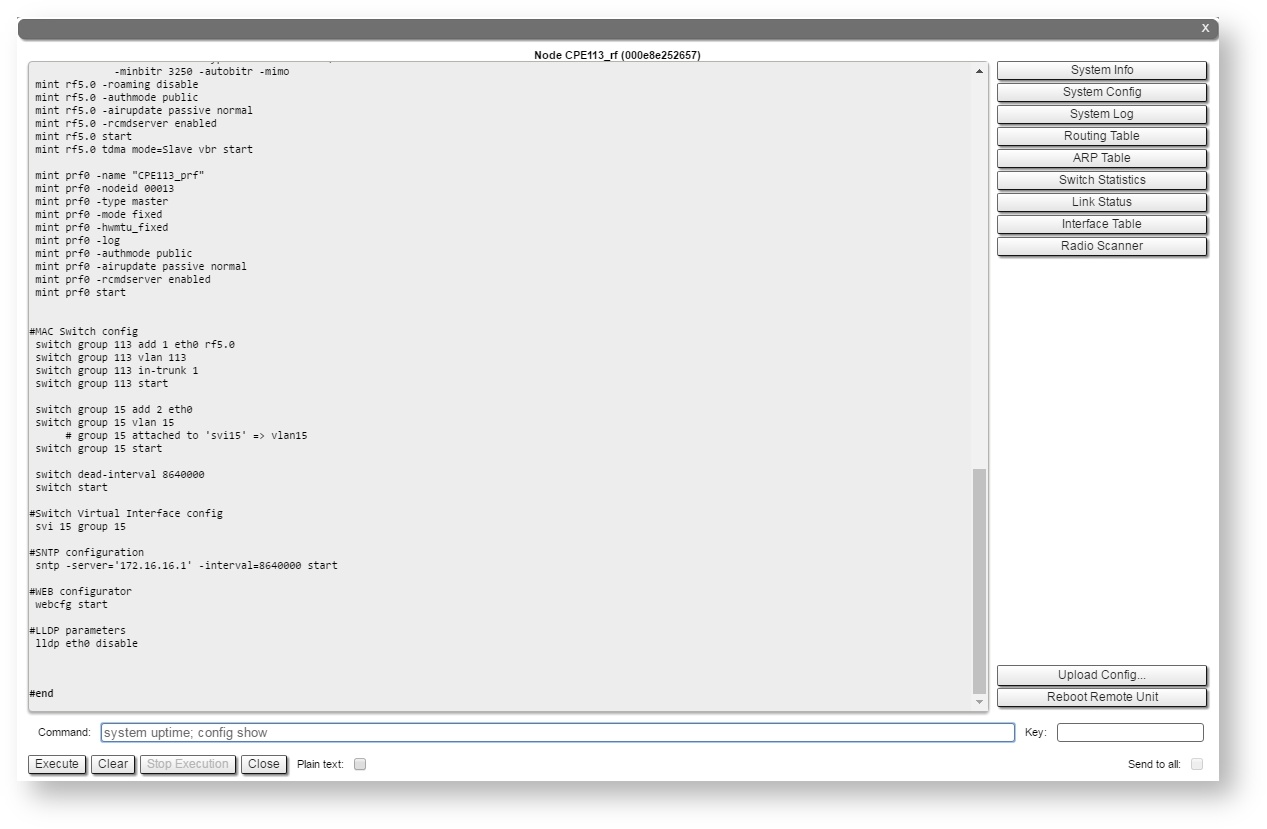
Remote Commands
| Anchor | ||||
|---|---|---|---|---|
|
The "Remote Commands" tool allows one MINT node to perform commands on another or all MINT nodes in the network at L2 level using WANFleX OS CLI commands.
...
| Center | |||||
|---|---|---|---|---|---|
|

By clicking the «System Info» button, you fill in the “Command” field command field with "system version, system uptime and system cpu" commands.
By clicking the «System Config» button, you fill in the “Command” field the command field with "system uptime and config show" commands.
By clicking the «System Log» button, you fill in the “Command” field command field with "system log show" command.
By clicking the «Routing Table» button, you fill in the “Command” field command field with "netstat -r" command.
By clicking the «ARP Table» button, you fill in the “Command” field command field with "arp view" command.
By clicking the «Switch Statistics» button, you fill in the “Command” field command field with "switch statistics" command.
By clicking the «Link Status» button, you fill in the “Command” field command field with "mint map detail" command.
By clicking the «Interface Table» button, you fill in the “Command” field command field with "netstat-i" command.
By clicking the «Radio Scanner» button, you fill in the command field with "muffer rf5.0 -t5 -p mac3" command.
All commands are executed automatically after clicking one of the buttons mentioned above.
| Note | ||
|---|---|---|
| ||
All WANFleX OS CLI commands can be executed from the "Remote Commands" tool. |
Link Restart
You can restart the wireless link (re-association, re-authentication and re-connection) by selecting the “Link Restart” radio button and then by clicking the «OK» button in the link options.
A warning message pops up before the link restart. If the operation is executed, the link disappears from "Device Status" page until it is reestablished again.
| Center | |||||
|---|---|---|---|---|---|
|

| Center | |||||
|---|---|---|---|---|---|
|
Extended Switch Statistics
The "Extended Switch Statistics" tools allow gathering complete information and enhanced statistics for each group of the unit.
In order to access the "Extended Switch Statistics" tools, click on the row of each switch group or kernel within the "Switch Statistics" section:
| Center | |||||
|---|---|---|---|---|---|
|
Two options are available: "Switch DB statistics" and "Switch VLAN statistics".
Switch DB Statistics
The "Switch DB Statistics" tool gathers complete information and enhanced statistics for each switch group, including kernel:
| Center | |||||
|---|---|---|---|---|---|
|
By clicking the «Close» button, you return to the "Device Status" page.
The "Auto Refresh" option is disabled by default. You can enable the auto refresh in order to have the statistics automatically refreshed.
Switch VLAN Statistics
The "Switch VLAN Statistics" tool gathers complete information and enhanced statistics for each VLAN created:
| Center | |||||
|---|---|---|---|---|---|
|
By clicking the «Close» button you return to the "Device Status" page.
The "Auto Refresh" option is disabled by default. You can enable the auto refresh in order to have the statistics automatically refreshed.