...
| Center | |||||
|---|---|---|---|---|---|
|
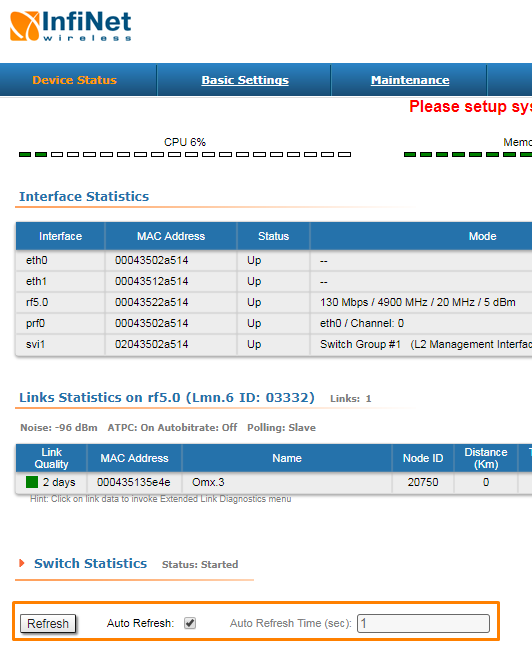
The "Device Status" page has the following sections:
...
| Center | |||||
|---|---|---|---|---|---|
|
| Warning | ||
|---|---|---|
| ||
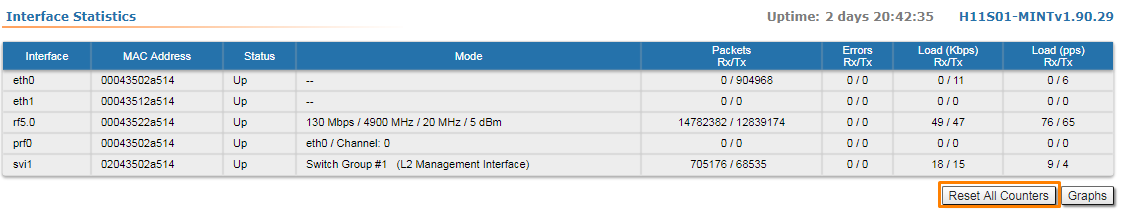
Clearing these counters by clicking the «OK» button in the pop-up page means losing the history data about the functionality of your unit. Avoid this operation unless you are completely sure you don’t need these data in the future. |
...
| Center | |||||
|---|---|---|---|---|---|
|

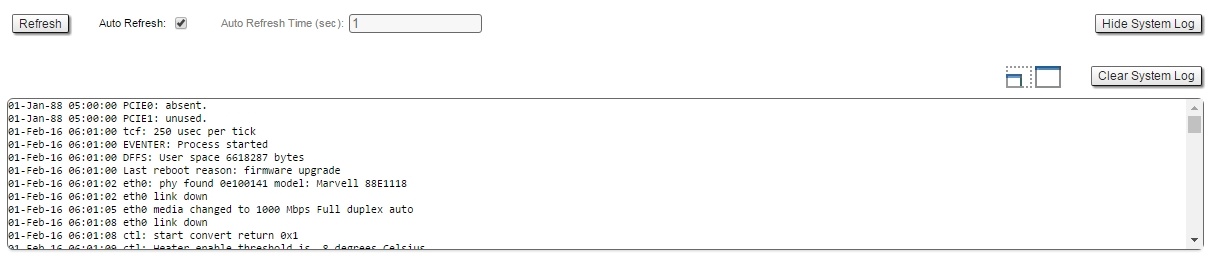
The "System Log" section allows browsing the unit’s system log. It is possible to minimize/enlarge the system log window by clicking the buttons:
...
| Center | |||||
|---|---|---|---|---|---|
|

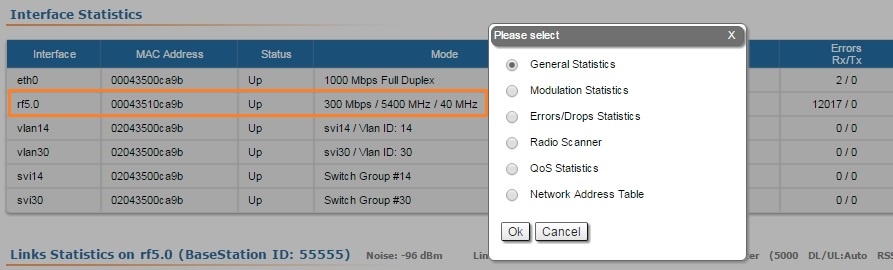
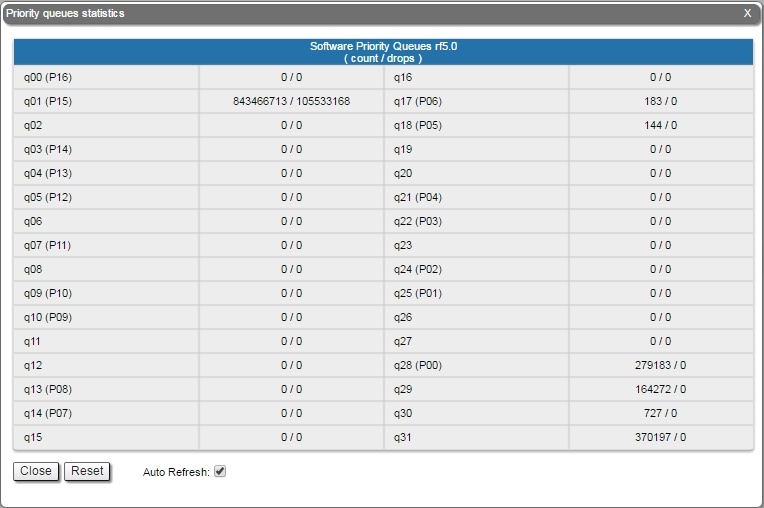
General Statistics
...
| Center | |||||
|---|---|---|---|---|---|
|


Modulation Statistics
...
| Center | |||||
|---|---|---|---|---|---|
|

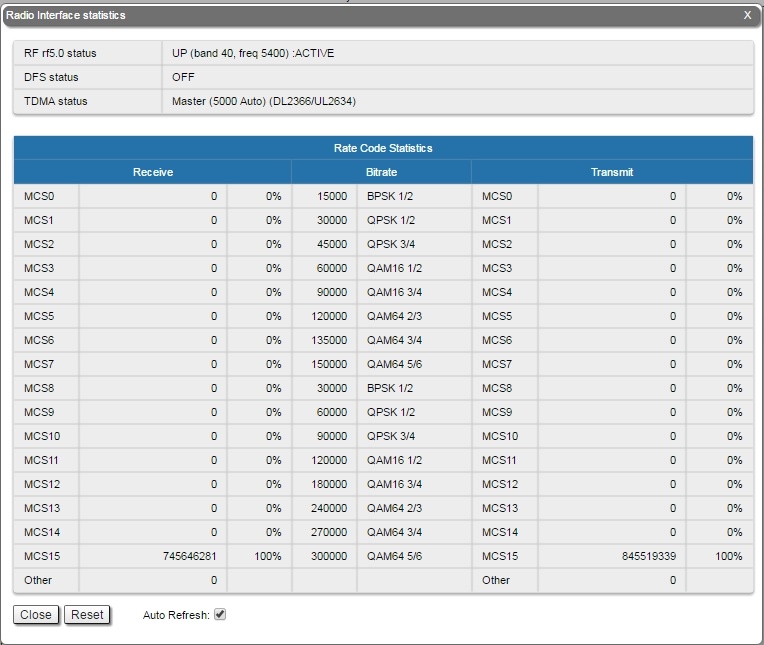
By clicking the «Close» button, you return to the "Device Status" page.
...
| Center | |||||
|---|---|---|---|---|---|
|


By clicking the «Close» button, you return to the "Device Status" page.
...
| Center | |||||
|---|---|---|---|---|---|
|


The abbreviations for each node type are also displayed in the interface:
...
| Center | |||||
|---|---|---|---|---|---|
|

By clicking the «Close» button, you return to the "Device Status" page.
...
| Center | |||||
|---|---|---|---|---|---|
|

By clicking the «Close» button, you return to the "Device Status" page.
...
| Center | |||||
|---|---|---|---|---|---|
|

By clicking the «Close» button, you return to the "Device Status" page.
...
| Center | |||||
|---|---|---|---|---|---|
|


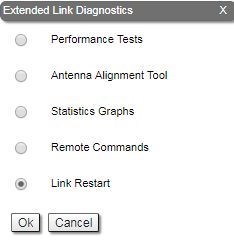
Five options are available: "Performance Tests", "Antenna Alignment Tool", "Statistics Graphs", "Remote Commands" and "Link Restart".
...
Performance tests for "MINT" and "TDMA" firmware are not the same. There are two tests in "MINT": one with graduation on bitrate, other in "Use MINT" mode. In "Use MINT" mode 8 tests are performed on established bitrate. In case of "TDMA" firmware teat of graduation test on bitrate is not performed. Both firmware support bidirectional test.
| Center | |||||
|---|---|---|---|---|---|
|

| Center | |||||
|---|---|---|---|---|---|
|


| Center | |||||
|---|---|---|---|---|---|
|


By clicking the «Run Tests»/«Stop Tests» buttons at the bottom of the page, you can start/stop the performance tests.
...
| Center | |||||
|---|---|---|---|---|---|
|


By clicking the «Start Test»/«Stop Test» buttons at the bottom of the page, you can start/stop the alignment test.
...
| Center | |||||
|---|---|---|---|---|---|
|

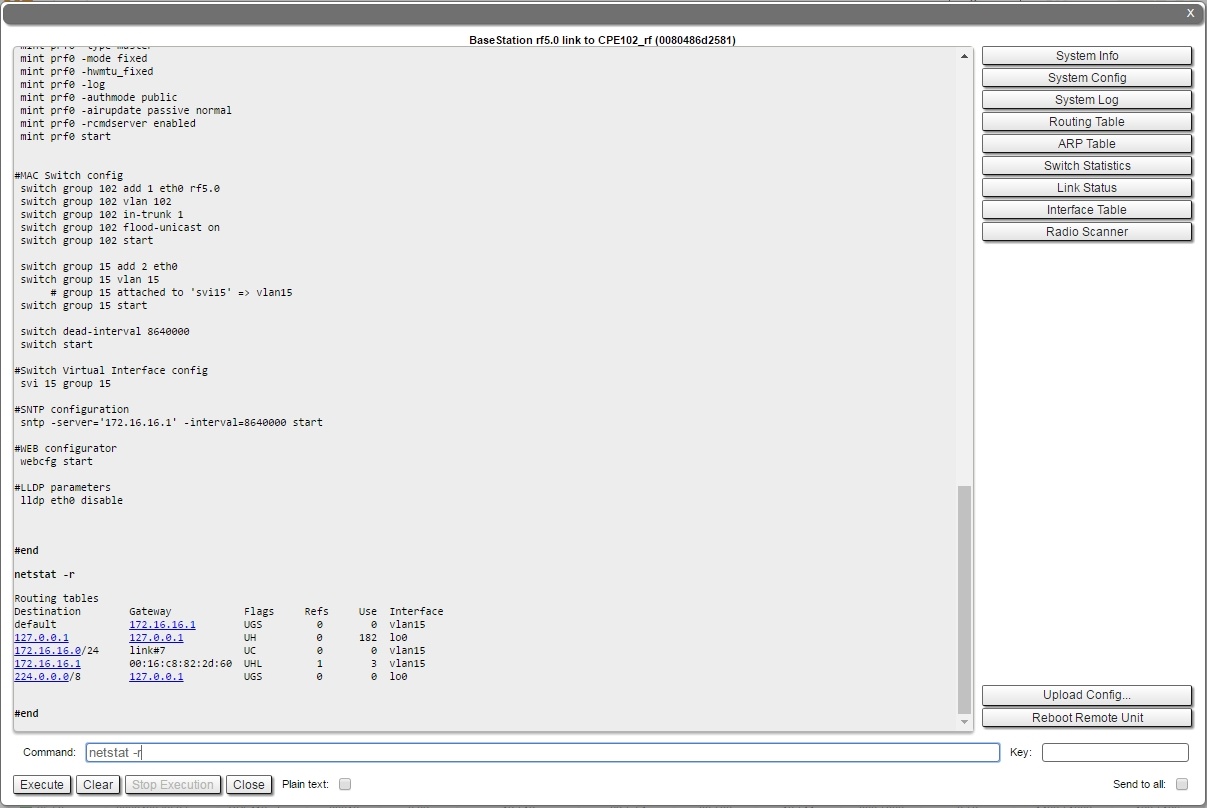
By clicking the «System Info» button, you fill in the command field with "system version, system uptime and system cpu" commands.
By clicking the «System Config» button, you fill in the command field with "system uptime and config show" commands.
By clicking the «System Log» button, you fill in the command field with "system log show" command.
By clicking the «Routing Table» button, you fill in the command field with "netstat -r" command.
By clicking the «ARP Table» button, you fill in the command field with "arp view" command.
By clicking the «Switch Statistics» button, you fill in the command field with "switch statistics" command.
By clicking the «Link Status» button, you fill in the command field with "mint map detail" command.
By clicking the «Interface Table» button, you fill in the command field with "netstat-i" command.
By clicking the «Radio Scanner» button, you fill in the command field with "muffer rf5.0 -t5 -p mac3" command.
All commands are executed automatically after clicking one of the buttons mentioned above.
| Note | ||
|---|---|---|
| ||
All WANFleX OS CLI commands can be executed from the "Remote Commands" tool. |
Link Restart
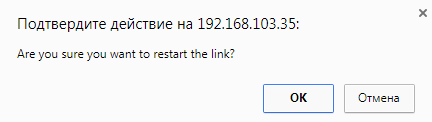
You can restart the wireless link (re-association, re-authentication and re-connection) by selecting the “Link Restart” radio button and then by clicking the «OK» button in the link options.
A warning message pops up before the link restart. If the operation is executed, the link disappears from "Device Status" page until it is reestablished again.
| Center | |||||
|---|---|---|---|---|---|
|

| Center | |||||
|---|---|---|---|---|---|
|
Extended Switch Statistics
The "Extended Switch Statistics" tools allow gathering complete information and enhanced statistics for each group of the unit.
In order to access the "Extended Switch Statistics" tools, click on the row of each switch group or kernel within the "Switch Statistics" section:
| Center | |||||
|---|---|---|---|---|---|
|
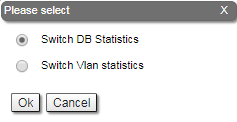
Two options are available: "Switch DB statistics" and "Switch VLAN statistics".
Switch DB Statistics
The "Switch DB Statistics" tool gathers complete information and enhanced statistics for each switch group, including kernel:
| Center | |||||
|---|---|---|---|---|---|
|


By clicking the «Close» button, you return to the "Device Status" page.
The "Auto Refresh" option is disabled by default. You can enable the auto refresh in order to have the statistics automatically refreshed.
Switch VLAN Statistics
The "Switch VLAN Statistics" tool gathers complete information and enhanced statistics for each VLAN created:
| Center | |||||
|---|---|---|---|---|---|
|


By clicking the «Close» button you return to the "Device Status" page.
The "Auto Refresh" option is disabled by default. You can enable the auto refresh in order to have the statistics automatically refreshed.