| Include Page | ||||
|---|---|---|---|---|
|
| Hide_comments |
|---|
InfiLINK 2x2 and InfiMUM InfiMAN 2x2 product families have a wide range of monitoring capabilities. This section describes the web interface with all the utilities it offers, as well as the CLI command review for maintenance and monitoring of device the devices and of the network status.
Web interface
This article is only intended to show briefly main paremeters point out the main parameters that are relevant for device monitoring and troubleshooting, for . For more information about the Web interface please go proceed to InfiNet Infinet Wireless R5000 - Web GUI - Technical User Manual.
Device status section
There is a hardware monitoring information at the top of the section. Displays the CPU, memory and flash usage of the unit in real time.
| Center |
|---|
|

Interface statistics
Displays the status, MAC address and operational mode for each interface, along with the traffic load for Rx/Tx, the number of packets transferred on Rx/Tx and the Rx/Tx errors.
...
Extended interface statistics can be obtained by clickind left button clicking on the the the interface you are interested in. Following The following statistics are available:
...
In order to ensure the necessary quality of service for each application, user or data stream, different prioritization queues are used. QoS statistics displays the number ofinbound and dropped packets for each priority queue, making it easy to identify and monitor the traffic types flowing through the unit.
...
Modulation Statistics
Displays the information about the modulation types, such as receive and transmit statistics for different coding schemeschemes. This statistic is available in the firmware version with "TDMA" support.
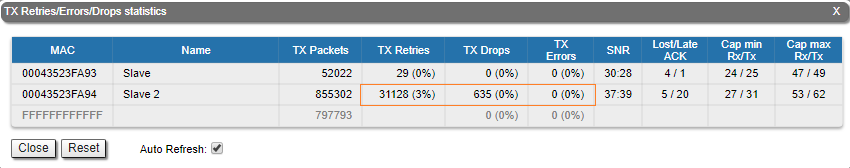
...
Displays the number of errors, retries and droped dropped packets during transmission for each link. The number of retries might tend must be close to zero , and if this number is more then than 10%, the radio can not cannot work properly.
| Center |
|---|
|
Radio Scanner
Allows to rapidly test the electromagnetic environment, visually estimates the efficiency of the air links link utilization, reveals any pulses received (from unknown sources) and estimates their power. Every source of interference is displayed separately containing useful information like: signal level, bitrate, source type and frequency. It is therefore easy to identify the unknown radio sources. The pulses field shows the total number of noise impulses, the average impulse signal level and the number of pulses per second. If the number of pulses per second is more than 60, it means that you have an interference problem, which can affect the quality of the link.
...
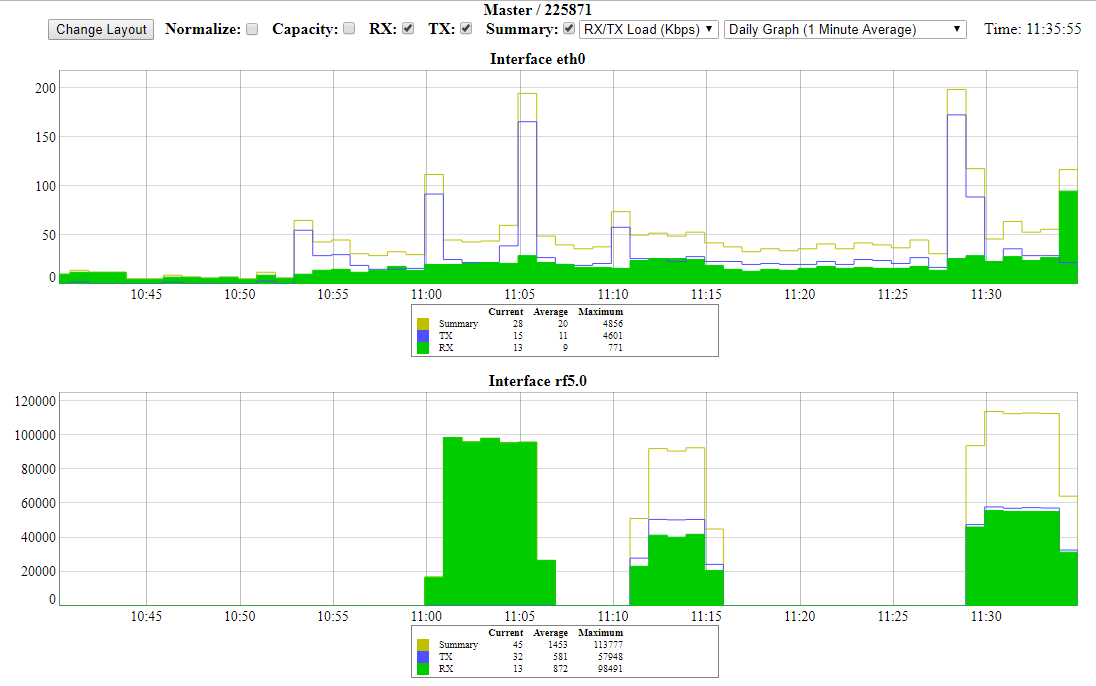
The same information that is displayed in real time in the statistics tables can be monitored continuously using graphs in order to visualize the evolution in real time, daily or monthly. The Rx/Tx Load and CPU load can be monitored for each interface and the reference level, retries, Rx/Tx load and bitrate graphs are available for the radio link monitor.
| Center |
|---|
|
Links Statistics on rf5.0
The top of this section displays the following information for the radio interface of the unit:
- Node name and ID
- Noise level
- Number of established links
- ATPC status (activated or deactivated)
- Autobitrate status (activated or deactivated)
- Polling mode (if the software with Polling technology support is used)
- TDMA parameters (if the software with TDMA technology support is used):
- Operational mode of the unit (Master/Slave)
- Time slot duration (in microseconds)
- Downlink percentage of the time slot
- Maximum RSSI level (in dBm)
- Maximum operational distance (in kilometers)
- RX/TX Capacity
...
Gives a color indication for the wireless connection quality with the neighbor unit, link uptime and some other options:
- Red: poor connection;
- Yellow: good connection;
- Green: excellent connection;
- F – relevance of remote unit firmware (optional). Idicates Indicates that the remote unit has the an older firmware than the local one;
- ? – system password of the remote unit (optional). Idicates Indicates that the remote unit has not the no system password;
- E – Ethernet port status on the remote device (optional). Indicates that the remote device Ethernet port is flapping.
RSSI (only for software with TDMA technology support)
Displays the power present in a of the received radio signal:
- "Rx" – the power of the received radio signal, measured at the local unit;
- "Tx" – the power of the received radio signal, measured at the remote unit;
- "*" – indicates the difference in the signals power of for the vertical and horizontal polarizations.
...
It is an abstract value that shows the fading margin for the current modulation. If it is lower than 10 dB or if there are a big difference between RX and TX (more than 5 dB), then this may indicate problems.
...
Displays the percentage of Tx and Rx retries of the neighbor unit, might tend to zero, if this number is more then than 10% the link can not cannot work properly.
Route map
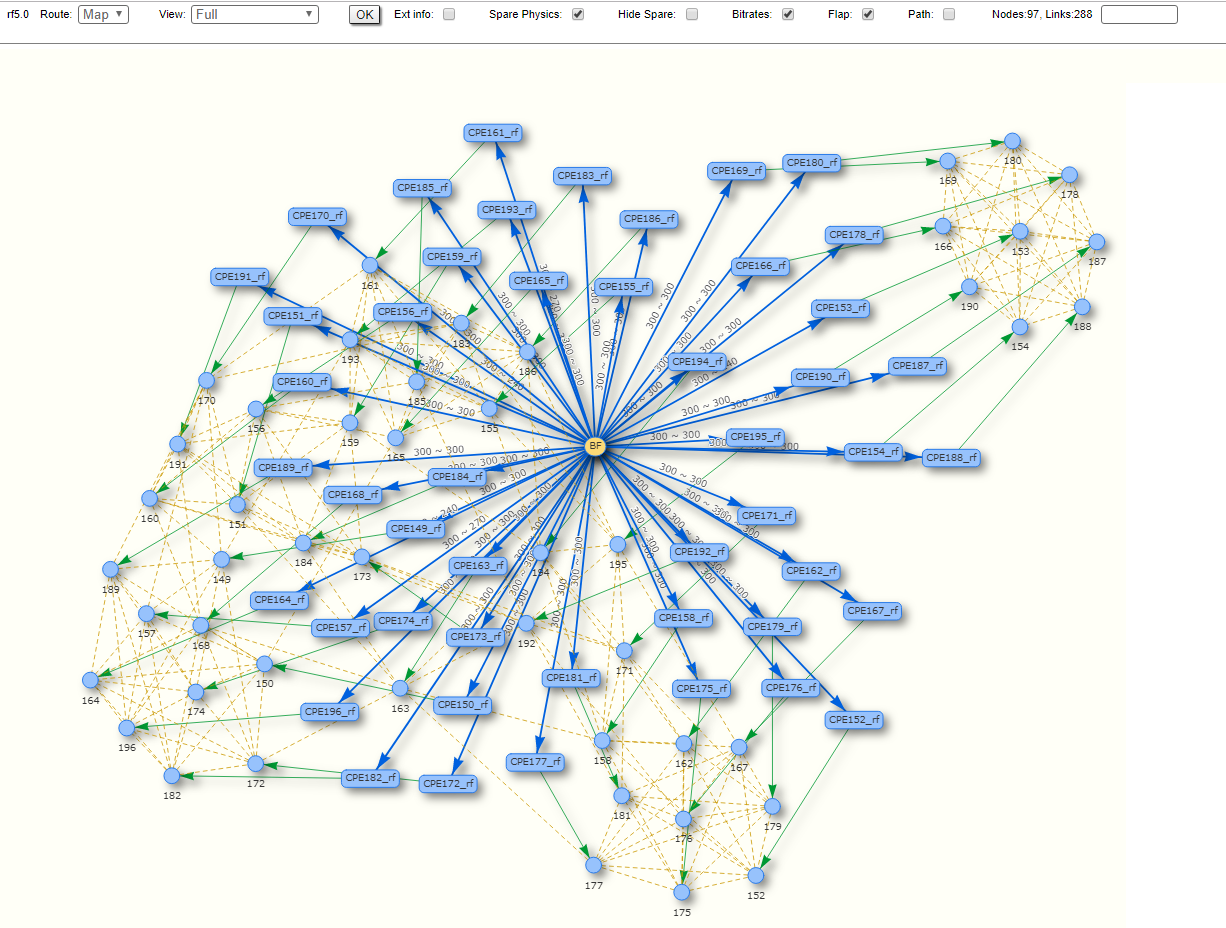
Displays the MINT topology schematic map with the visualization of the active and alternative routes to each node. Allows to visually determine the network connectivity and complexity and to track the route switching, including mobile objects, shows showing also the bitrate value, ethernet Ethernet interface state and wired connections.
| Center |
|---|
|
Performance test
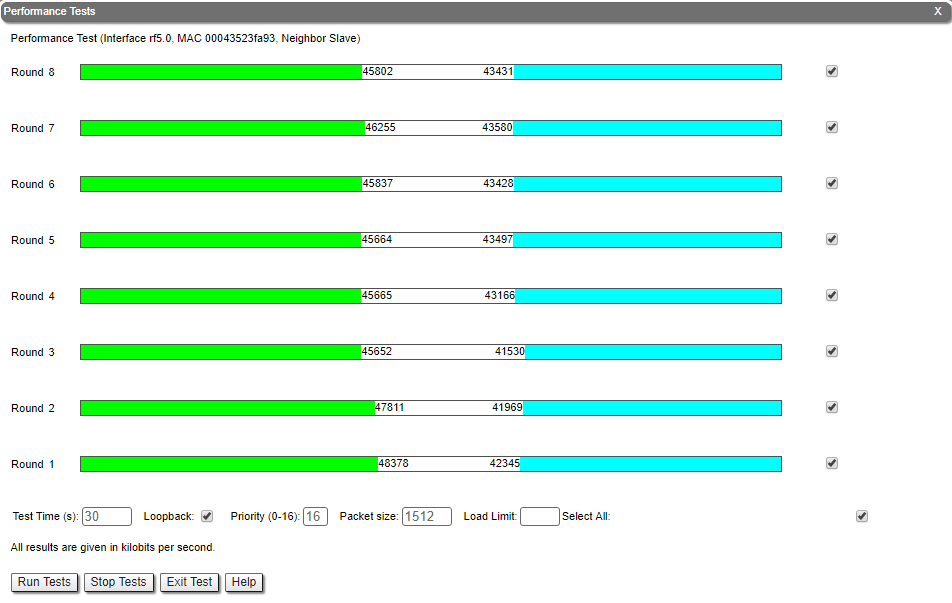
Traffic is generated one way or bidirectional in order to test the link throughput. In For the software with Polling technology support, traffic is generated with different bitrates , and it will show display the maximum throughput obtained for each bitrate and , together with the number of retries (the number of retries reflects the quality of the link – an increased number of retries or retransmissions indicates a bad quality). In For the software with TDMA technology support, traffic is generated with maxium the maximum possible bitrate. In case of testing the link previously identified of being a link that operates in poor radio conditions, it shows that higher bitrates have a lot of retries and low throughput.
| Center |
|---|
|
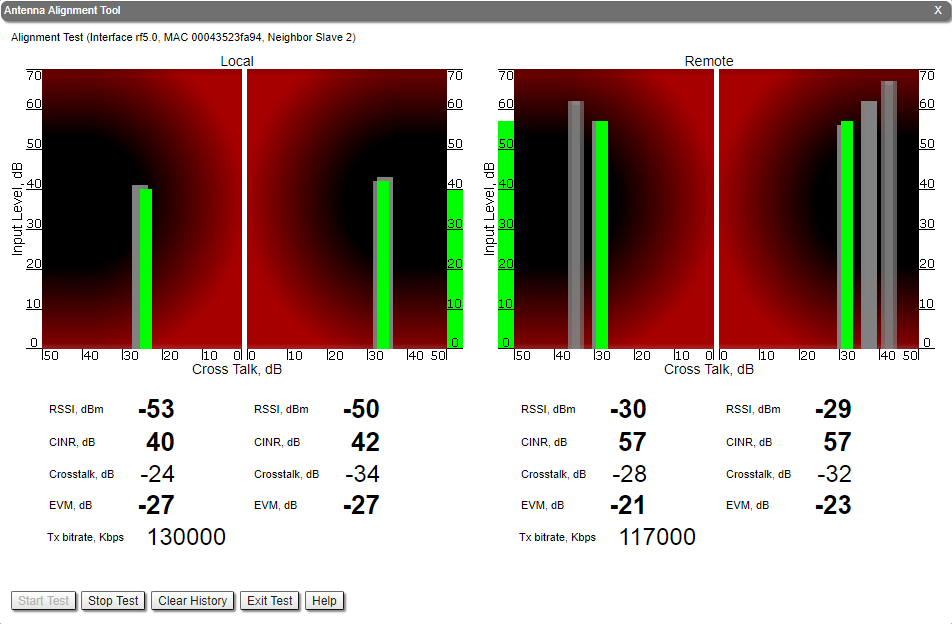
Antenna Alignment
An intuitive graphical tool that helps to check the antenna alignment and to troubleshoot problems related to the link quality (errors, retries, poor signal level). It provides information about the RSSI level, the signal level, retries in percentage, Error Vector Magnitude (EVM) and bitrate. Some basic guidelines:
- For correct alignment the green graphical indication for the signal level should be seen as close as possible to the center of the black area.
- Parameter display section: the optimal level for the RSSI is between -60 to -40 dBm, the CINR (carrier-to-interference-and-noise ratio), should be equal to or greater than 28 dB. The Crosstalk indicates the influence of the vertical and horizontal polarizations on each other, and it should not exceed -20 dB. Error Vector Magnitude shows how far are the real constellation points from the ideal ones in the modulation scheme. The optimal value is below -21 dB. If the CINR level is more than 50 dB the Tx power should be reduced. Sometimes levels below 12 dB can be enough to have an operational link, but for this to happen, the EVM should be more than 21 and the retries should be very small.
| Center |
|---|
|
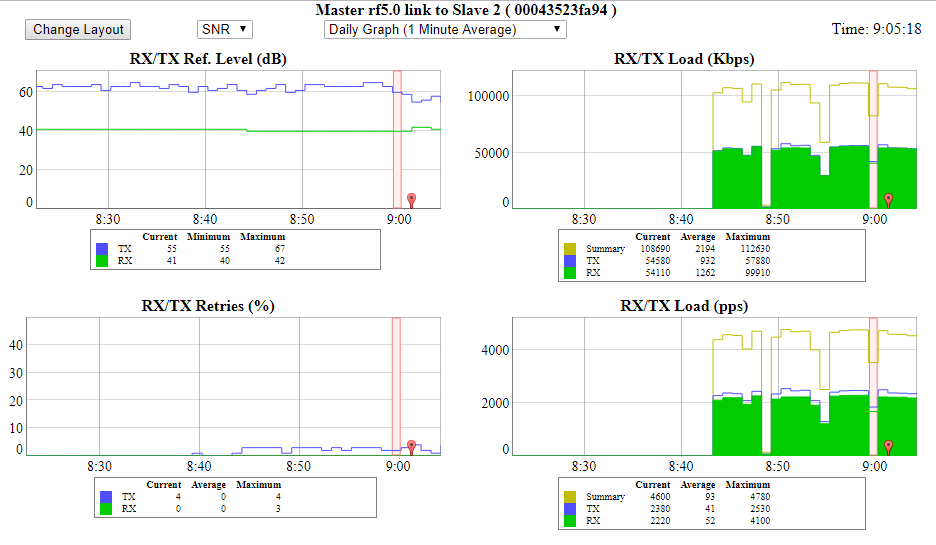
Statistics graphs
Allows to monitor the device parameters represented in the graphical charts. It helps to find out the exact time when the problem occur and critical events like link outages or frequency swaps are marked by small red markers on the bottom of each graph.
| Center |
|---|
|
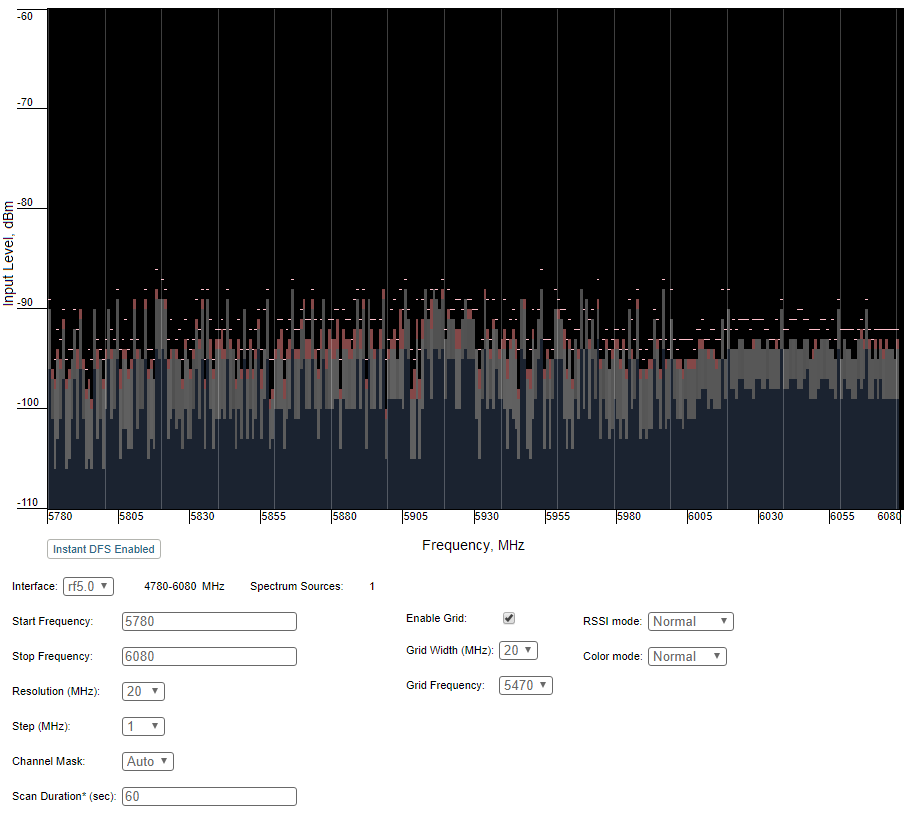
Spectrum analyzer
Performs a scan of the electromagnetic spectrum in the desired frequency range and provides detailed information about the emitting sources present in the area. While the test is being performed, the link is disconnected and the unit will function in listening mode only. Interference can be easily spotted this way.
Interference pulses are displayed for the frequencies that are polluted. By pointing over the desired pulse, detailed information will be displayed about the strength of the interference: input level, max, average and high RSSI. As it can be seen in the picture below, it is easy to spot the affected areas in the spectrum. The scan is available based on customized parameters: start/stop frequency, band, step, channel mask and scan duration.
| Center |
|---|
|
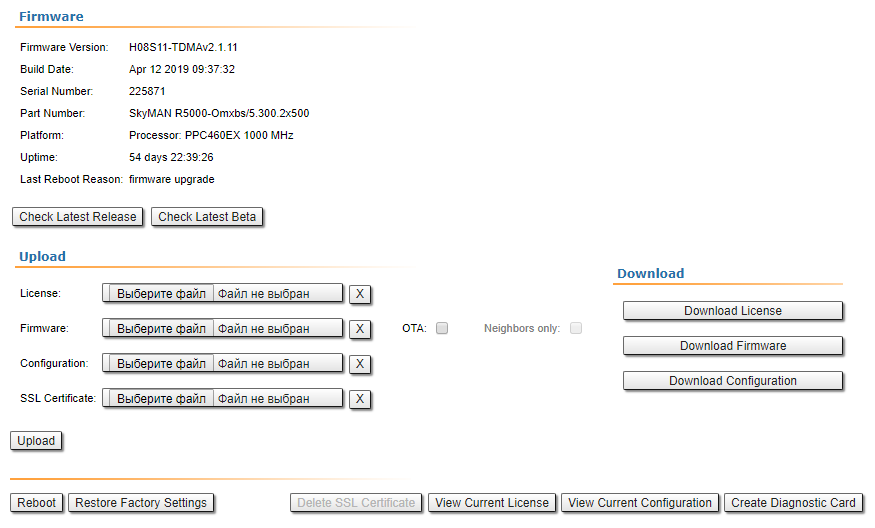
Maintenance
The following management options are available from the Web interface, Maintenance section:
Firmware, license and configuration management
The existing firmware, license or configuration can be viewed, downloaded or updated.
Unit reboot
For remote reboot of the unit.
Restore to factory settings
If needed, the unit can be restored to the factory default settings.
Diagnostic card creation
In order to gather complete troubleshooting information and send it to the InfiNet Wireless technical support team, a diagnostic card must be created. This includes the configuration, system log messages, various output parameters, system messages, license information etc.
| Center |
|---|
|
Remote commands
In addition, commands can be sent over the radio link to the remote unit. This is a useful feature when for example, the IP address of the remote unit is not reachable (it can be set to a different network class or not set at all) and its management becomes unavailable. In this case, the configuration of the remote unit can be checked using the remote commands. Information like routing table, ARP table, switch statistics etc can be queried and commands can be sent over the radio link in order to modify the existing configuration.
Command Line Interface
The CLI represents a Unix-like command line in Figure 5) and low throughput.
...
interface used for the management and configuration of the device. CLI is available from the Web interface in the Command Line page or via Telnet or SSH connection. SSH is preferred because of the security features. Telnet is enabled by default, although the built-in SSH server requires activation using the command "sshd start".
MINT map
The "mint map" utility that displays information about all MINT neighbors for an easy tracking and troubleshooting, allows to estimate the signal level and current bitrate. The "mint map detail" command shows also additional information about each link, including the connection cost.
| Center | |||||||
|---|---|---|---|---|---|---|---|
|
Ltest
A utility for radio link testing, providing real-time monitoring of the current and maximum signal levels, retries, errors and throughput testing.
| Center | |||||||
|---|---|---|---|---|---|---|---|
|
The command output for the software with TDMA technology support is limited by "amp/max" and "rtt" columns.
| Center | |||||||
|---|---|---|---|---|---|---|---|
|
Muffer
The Muffer module allows to perform rapid testing of the electromagnetic environment showing the radio links utilization efficiency, the sources of interference and their power. The following muffer modes are available:
MAC
Analyzes data packets only.
MAC2
Analyzes data packets and link-level ACK messages (if possible).
| Center | |||||||
|---|---|---|---|---|---|---|---|
|
MAC3
In addition to the mac2 mode, includes impulse noisy signals calculation. Displays the number of detected pulses, their average signal level and the number pulses per second.
MYNET
Analyzes only packets from the given network.
Sensor
Enables the spectrum analyzer mode, provides deep analysis of the radio emission sources. The information is displayed in an alphanumeric format.
Statistics
Enables statistic mode which is used to estimate the link load for each client. The amount of packets sent and received, and the retransmissions are shown for each MAC address participating in the data exchange.
| Center | |||||||
|---|---|---|---|---|---|---|---|
|
| Note |
|---|
For more information about command syntax and scan result, please proceed to WANFleX - Technical User Manual |