| Hide_comments |
|---|
InfiLINK 2x2 and InfiMUM 2x2 product families have a wide range of monitoring capabilities. This section describes web interface with all utilities it offers as well as CLI command review for maintenance and monitoring of device and network status.
Web interface
This article is only intended to show briefly main paremeters for device monitoring and troubleshooting, for more information about Web interface please go to InfiNet Wireless R5000 - Web GUI - Technical User Manual.
Device status section
There is a hardware monitoring information at the top of the section. Displays Displays the CPU, memory and flash usage of the unit in real time.
| Center |
|---|
|

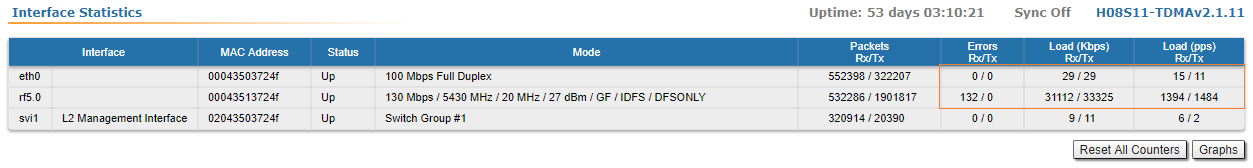
Interface statistics
Displays the status, MAC address and operational mode for each interface, along with the traffic load for Rx/Tx, the number of packets transferred on Rx/Tx and the Rx/Tx errors.
| Center |
|---|
|
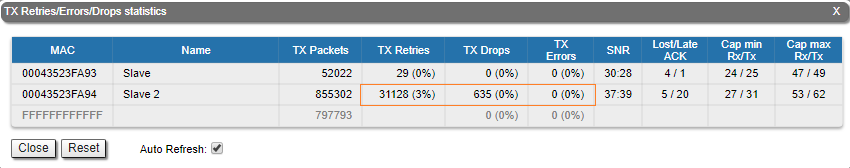
Extended interface statistics can be obtained by clickind left button on the interface you are interested in. Following statistics are available:
...
Displays the number of errors, retries and droped packets during transmission for each link. The number of retries might tend to zero, if this number is more then 10% the radio can not work properly.
| Center |
|---|
|
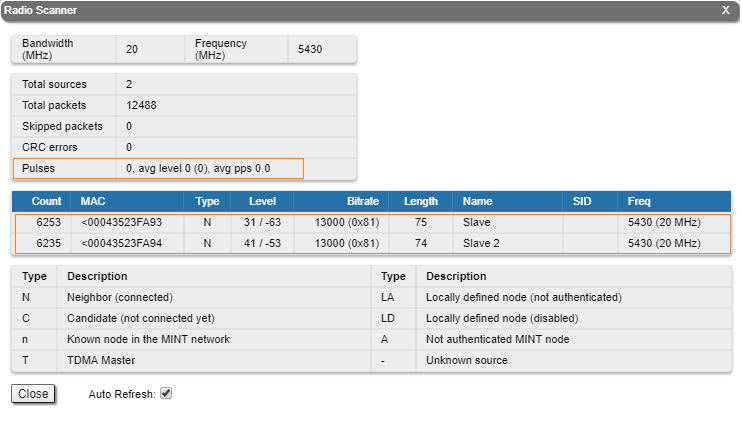
Radio Scanner
Allows to rapidly test the electromagnetic environment, visually estimates the efficiency of the air links utilization, reveals any pulses received (from unknown sources) and estimates their power. Every source of interference is displayed separately containing useful information like: signal level, bitrate, source type and frequency. It is therefore easy to identify the unknown radio sources. The pulses field shows the total number of noise impulses, the average impulse signal level and the number of pulses per second. If the number of pulses per second is more than 60, it means that you have an interference problem, which can affect the quality of the link.
| Center |
|---|
|
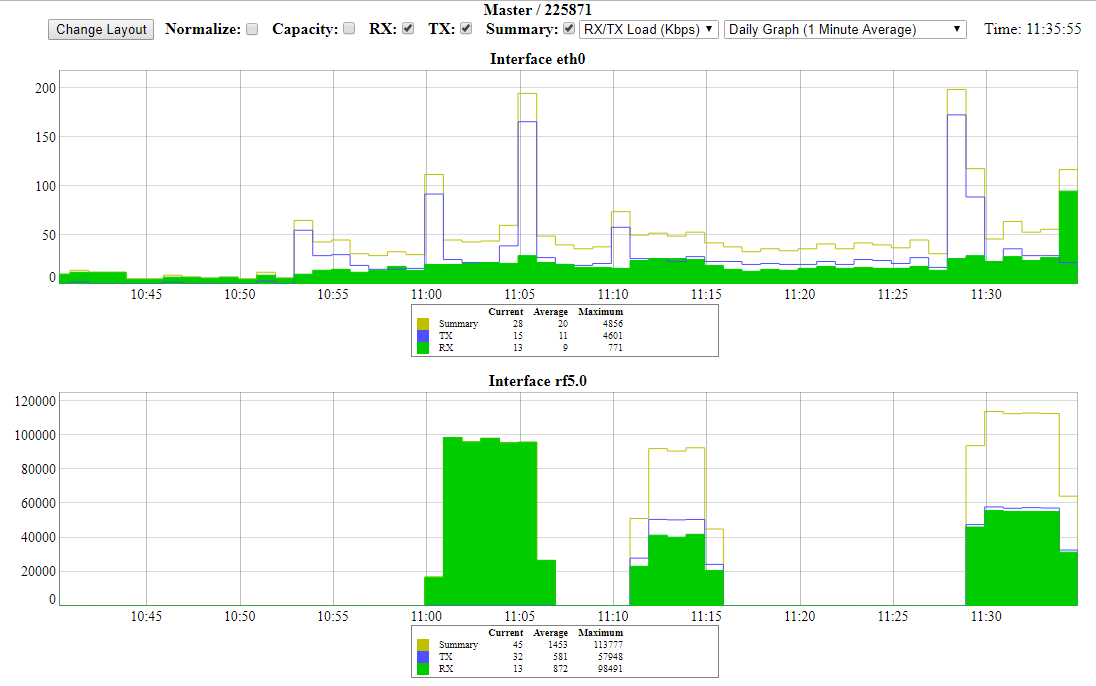
Graphs
The same information that is displayed in real time in the statistics tables can be monitored continuously using graphs in order to visualize the evolution in real time, daily or monthly. The Rx/Tx Load and CPU load can be monitored for each interface and the reference level, retries, Rx/Tx load and bitrate graphs are available for the radio link monitor.
| Center |
|---|
|
Links Statistics on rf5.0
The top of this section displays the following information for the radio interface of the unit:
- Node name and ID
- Noise level
- Number of established links
- ATPC status (activated or deactivated)
- Autobitrate status (activated or deactivated)
- Polling mode (if software with Polling technology support is used)
- TDMA parameters (if software with TDMA technology support is used):
- Operational mode of the unit (Master/Slave)
- Time slot duration (in microseconds)
- Downlink percentage of the time slot
- Maximum RSSI level (in dBm)
- Maximum operational distance (in kilometers)
- RX/TX Capacity
| Center |
|---|
|
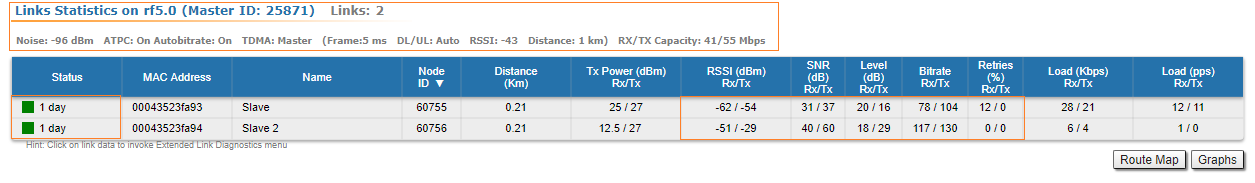
Status
Gives a color indication for the wireless connection quality with the neighbor unit, link uptime and some other options:
- Red: poor connection;
- Yellow: good connection;
- Green: excellent connection;
- F – relevance of remote unit firmware (optional). Idicates that the remote unit has the older firmware than the local one;
- ? – system password of the remote unit (optional). Idicates that the remote unit has not the system password;
- E – Ethernet port status on the remote device (optional). Indicates that the remote device Ethernet port is flapping.
RSSI (only for software with TDMA technology support)
Displays the power present in a received radio signal:
- "Rx" – the power of received radio signal, measured at the local unit;
- "Tx" – the power of received radio signal, measured at the remote unit;
- "*" – indicates the difference in the signals power of the vertical and horizontal polarizations.
Desirable values are between -40 and -60 dBm.
SNR
Displays the ratio of the useful signal power to the noise power for the input and output signals at the neighbor unit (in dB), should be equal to or greater than 28 dB.
Level
It is an abstract value that shows the fading margin for the current modulation. If it is lower than 10 dB or if there are a big difference between RX and TX (more than 5 dB) then this may indicate problems.
Bitrate
Displays the current bitrate value for the Tx and Rx signals of the neighbor unit.
Retries
Displays the percentage of Tx and Rx retries of the neighbor unit, might tend to zero, if this number is more then 10% the link can not work properly.
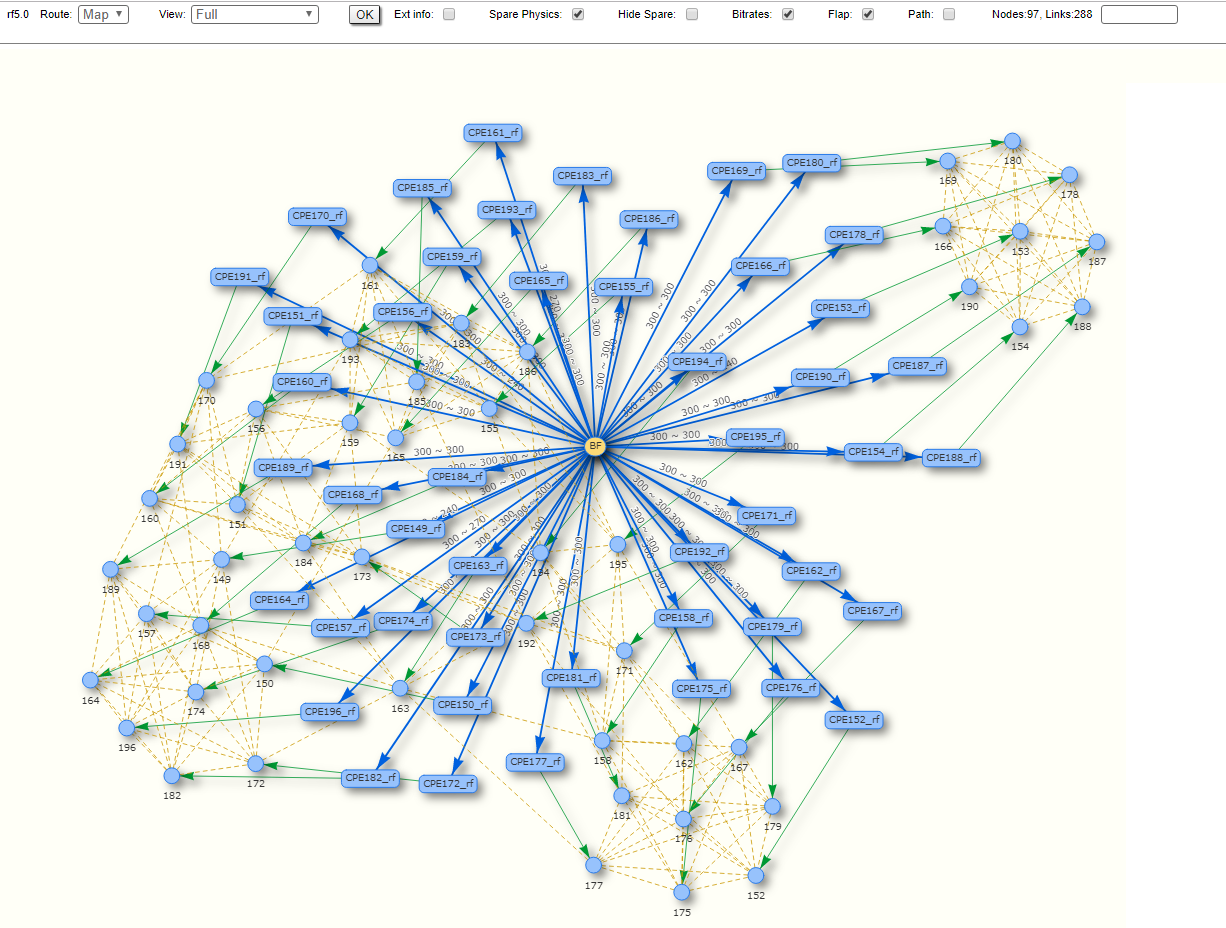
Route map
Displays the MINT topology schematic map with the visualization of the active and alternative routes to each node. Allows to visually determine the network connectivity and complexity and to track the route switching, including mobile objects, shows also bitrate value, ethernet interface state and wired connections.
| Center |
|---|
|
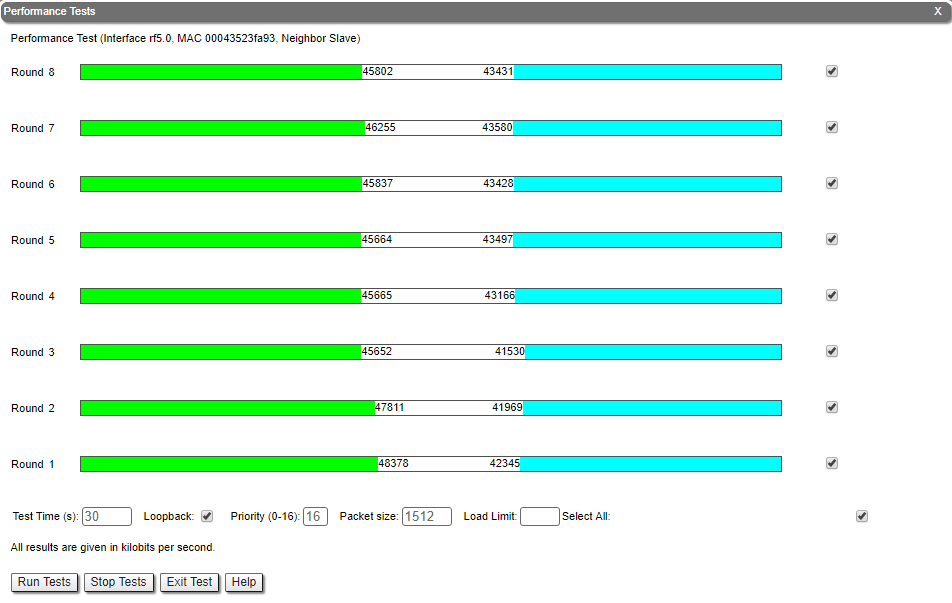
Performance test
Traffic is generated one way or bidirectional in order to test the link throughput. In software with Polling technology support traffic is generated with different bitrates, it will show the maximum throughput obtained for each bitrate and the number of retries (the number of retries reflects the quality of the link – an increased number of retries or retransmissions indicates a bad quality). In software with TDMA technology support traffic is generated with maxium possible bitrate. In case of testing the link previously identified of being in poor radio conditions, it shows that higher bitrates have a lot of retries (the red line in Figure 5) and low throughput.
| Center |
|---|
|