| Include Page | ||||
|---|---|---|---|---|
|
| Hide_comments |
|---|
This page describes the capabilities of the InfiLINK XG product family web interface for device maintenance and network status monitoring. This article is only intended to briefly show briefly main paremeters the main parameters that are relevant for device monitoring and troubleshooting, for . For more information about the Web interface please proceed to to the InfiLINK XG / InfiLINK XG 1000 - Technical User Manual.
Monitoring options
...
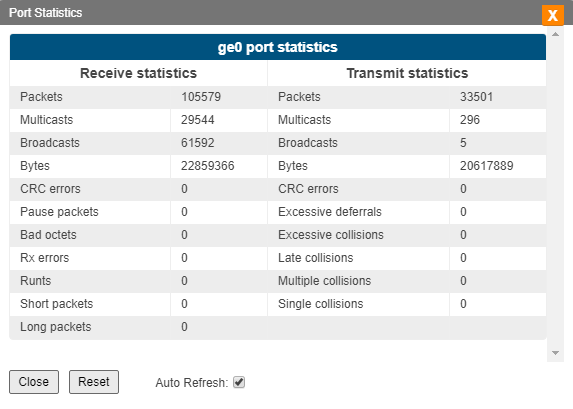
Interface status
The "Status" section displays statistic for each physical interface as well as for logical "management" interface. The information about load, packets packet number and errors is shown on the main page.
...
In order to review detailed information about the transmitted packets and the errors type, extended statistic statistics can be displaed displayed by the left click clicking on the interface you are interested in.
| Center |
|---|
|
Wireless link statistic
This section allows you to monitor the radio lonk link parameters. The link status and main settings are displayed on top of this section, while the bottom part shows statistic statistics for the Master and Slave unit, for both uplink and downlink direction, in directions. In case of the InfiLINK XG 1000 family, the information is shown for both carriers.
...
In addition to capacity and frames numbers number, there are a few important parameters which allows allow to perform radio link quality monitoring.
MCS
Displays the modulation and coding scheme that is in use at the receiver side. There are 11 MCS schemes available and if the AMC is set to auto, the MCS will dynamically change its value based on the link quality (at both units - local and remote). The maximum capacity varies based on the MCS in use. For example, for QAM256 7/8 (8), : "QAM256" is the modulation in use, "7/8" is the coding scheme in use (for every 7 data bits, the encoder produces 8 bits to be sent over the air) and "(8)" represents the index of the MCS in use.
CINR
Displays the Carrier to Interference and Noise Ratio measured in downlink and expressed in dB. CINR can be limited either due to too a low signal level or because of the interference from other radios. In order to reach highest obtain the highest modulations, values higher or equal to 28 dB are required.
RSSI
Displays the Received Signal Strength Indicator measured in downlink and expressed in dBm. Represents the power of the received signal as a whole (useful signal plus noise and interferencesinterference) and if it goes below the level of the sensitivity, the link will go down. The recommended range for achieving the best performance is between -60 and -40 dBm.
Acc TBER
Displays the Transport Block Error Ratio, showing the percentage of errored transport blocks with errors. Each application has an acceptable air block error rate defined as a minimum requirement.
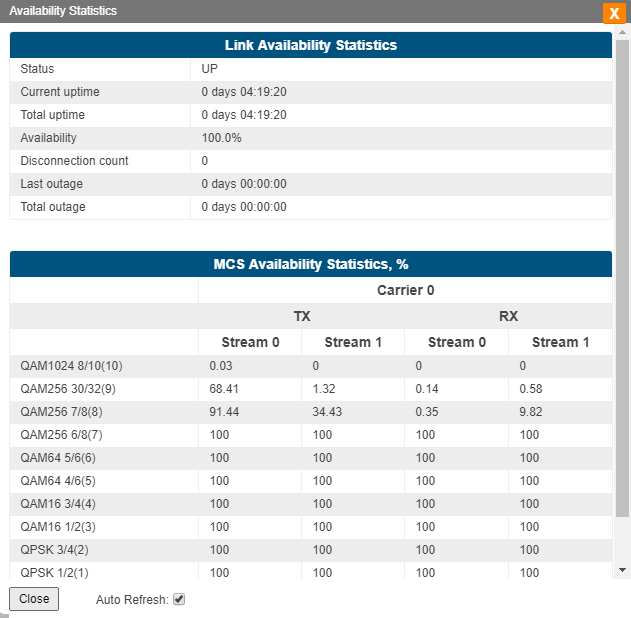
Availability statistics
Link and MCS availability statistics are available on the bottom of the section by clicking clicking on the "Show Availability Statistics" button.
| Center |
|---|
|
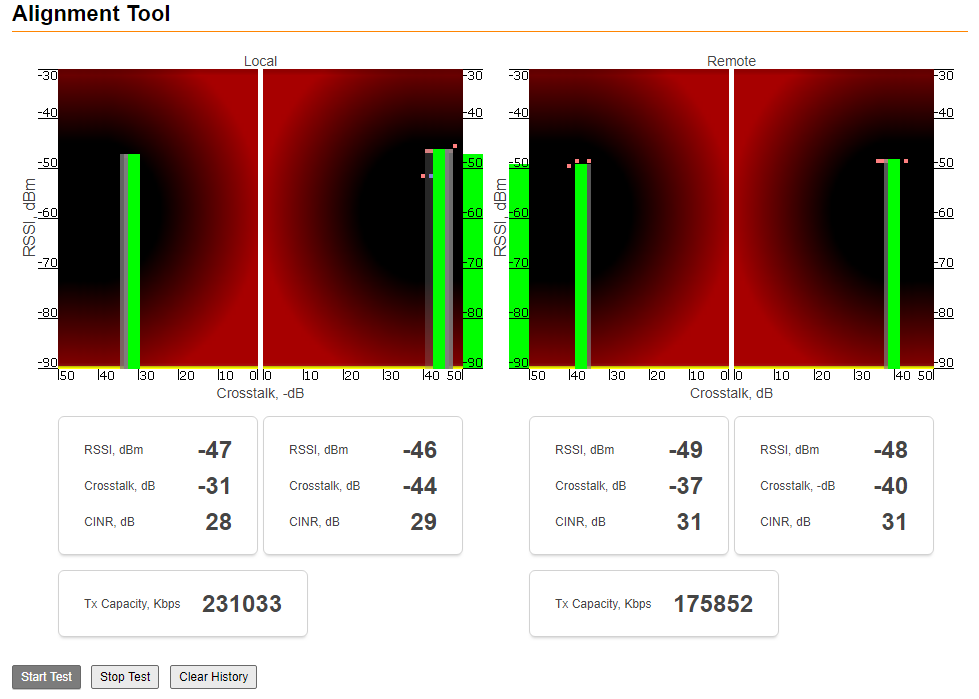
Antenna alignment tool
An intuitive graphical tool that helps to check the antenna alignment and to troubleshoot problems related to the link quality (errors, poor signal level). It provides information about the RSSI level, the signal level and bitrate. Some basic guidelines:
- For correct alignment, the green graphical indication for the signal level should be seen as close as possible to the center of the black area.
- In the text part, the optimal level for the RSSI is between -60 to -40 dBm, the CINR (carrier-to-interference-and-noise ratio) , should be equal to or greater than 28 dB. The Crosstalk indicates the influence of the vertical and horizontal polarizations on each other, and it should not exceed -20 dB.
| Center |
|---|
|
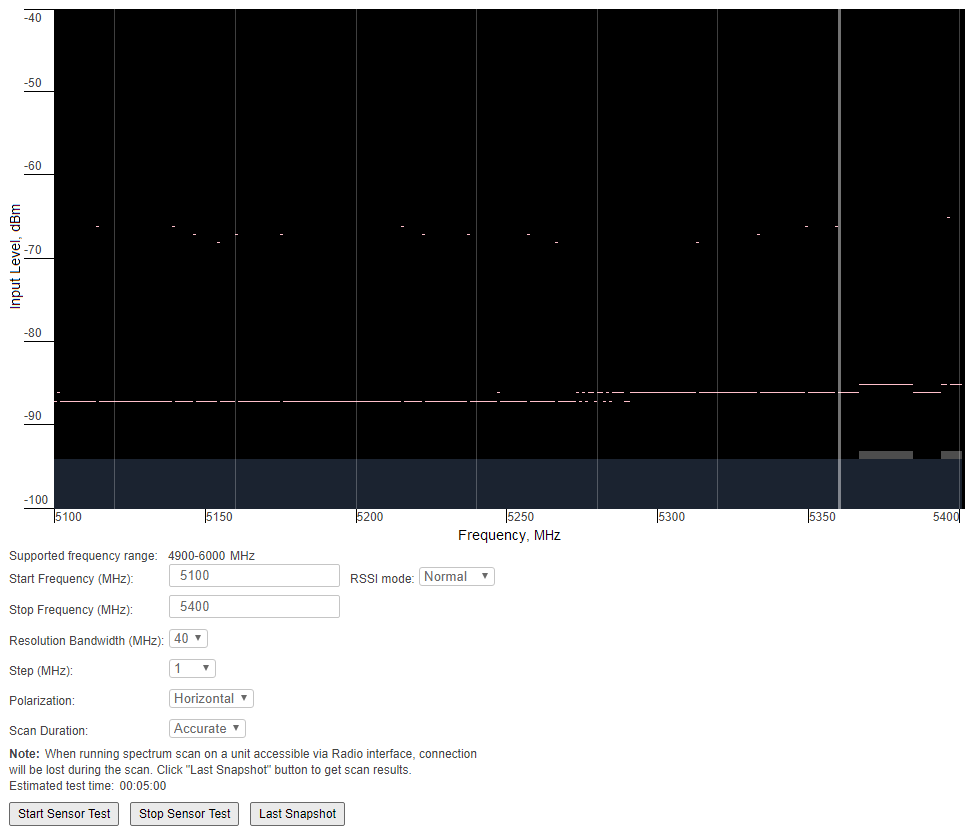
Spectrum analyzer
Performs a scan of the electromagnetic spectrum in the desired frequency range and provides detailed information about the emitting sources present in the area. While the test is being performed, the link is disconnected and the unit will function operate in listening mode only. Interferences Interference can be easily spotted this way. Interference pulses are displayed for the frequencies that are pollutedbusy. By pointing over the desired pulse, detailed information will be displayed about the strength of the interference: input level, max and average RSSI. The scan is available based on customized parameters: start/stop frequency, band, step, and scan duration.
| Center |
|---|
|
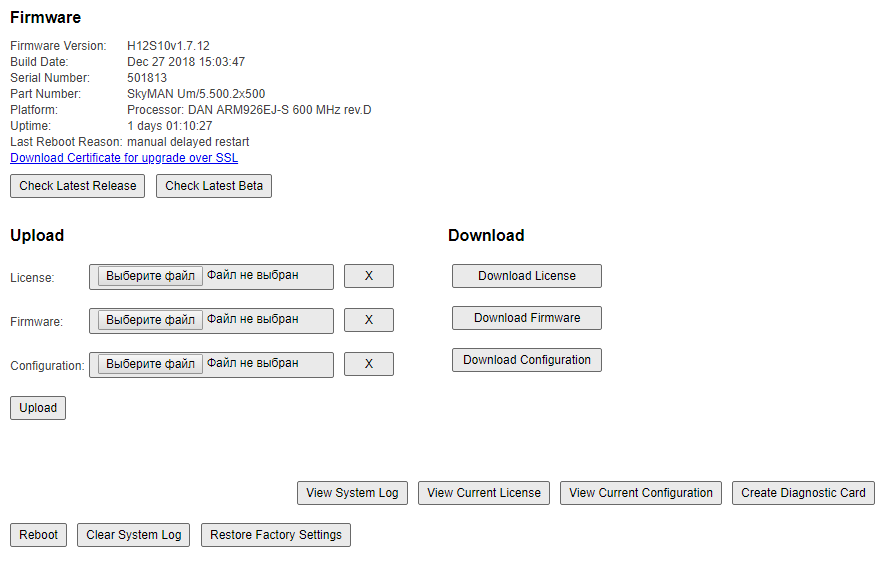
Maintenance
The following management options are available from the Web interface, Maintenance section:
Firmware, license and configuration management
The existing firmware, license or configuration can be viewed, downloaded or updated. The firmware can be updated in two ways, automatically by clicking the "Check Latest Release" button or manually by uploading it from the FTP server https://ftp.infinet.ru/.
Unit reboot
For remote reboot of the unit.
Restore to factory settings
If needed, the unit can be restored to the factory default settings.
Diagnostic card creation
In order to gather complete troubleshooting information and send it to the InfiNet Wireless technical support team, a diagnostic card must be created. This includes the configuration, system log messages, various output parameters, system messages, license information etc.
| Center |
|---|
|