The "Status" page is displayed by default after the authentication step. It displays the main parameters of the unit the unit in real-time.
| Center |
|---|
| Scroll Title |
|---|
| title | Figure - Status page |
|---|
|  Image Removed Image Removed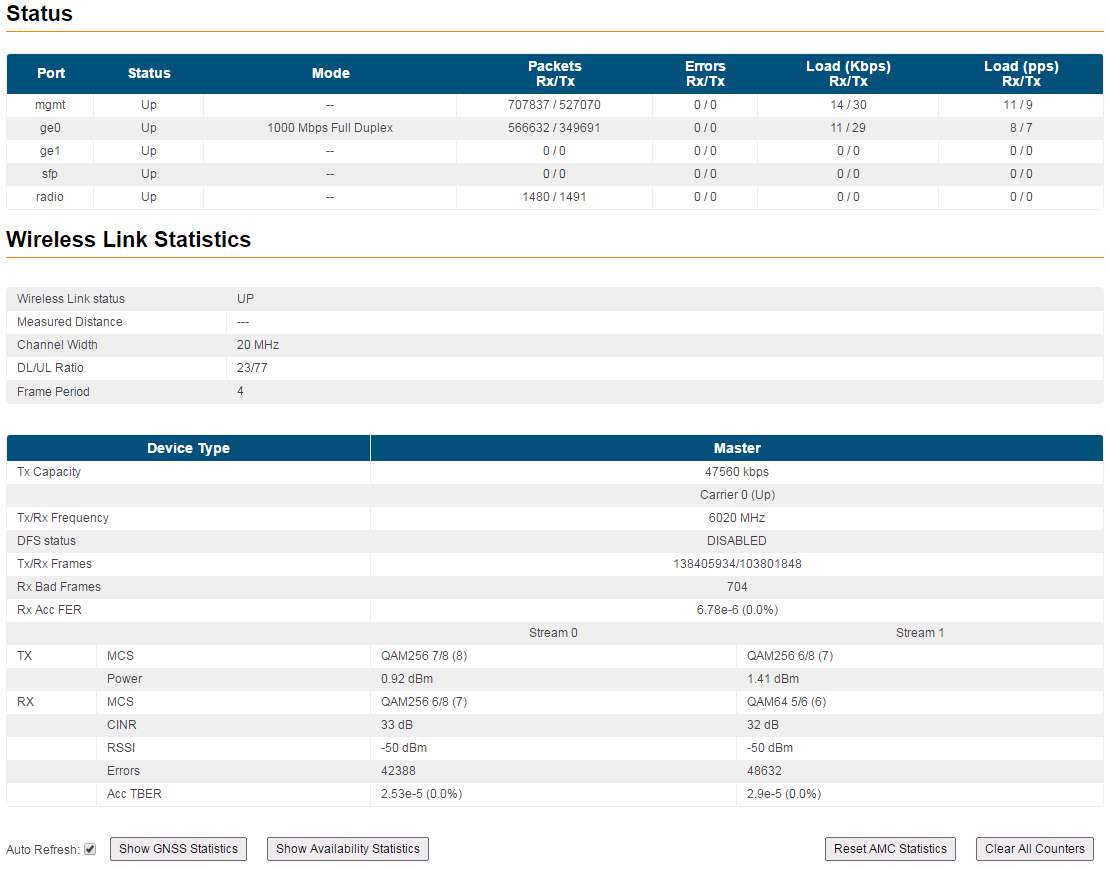 Image Added Image Added
|
|
You can set the "Auto Refresh" option to refresh the statistics automatically. The “Auto refresh” is available in the bottom-left side of the "Status" page, along with the «Show GNSS Statistics» button. If GNSS is in use and GNSS monitoring is enabled, its statistics can be queried by clicking on «Show GNSS Statistics».
To obtain link and MCS availability statistics use the "Show Availability Statistics" button.
| Center |
|---|
| Scroll Title |
|---|
| title | Figure - Availability Statistics |
|---|
| 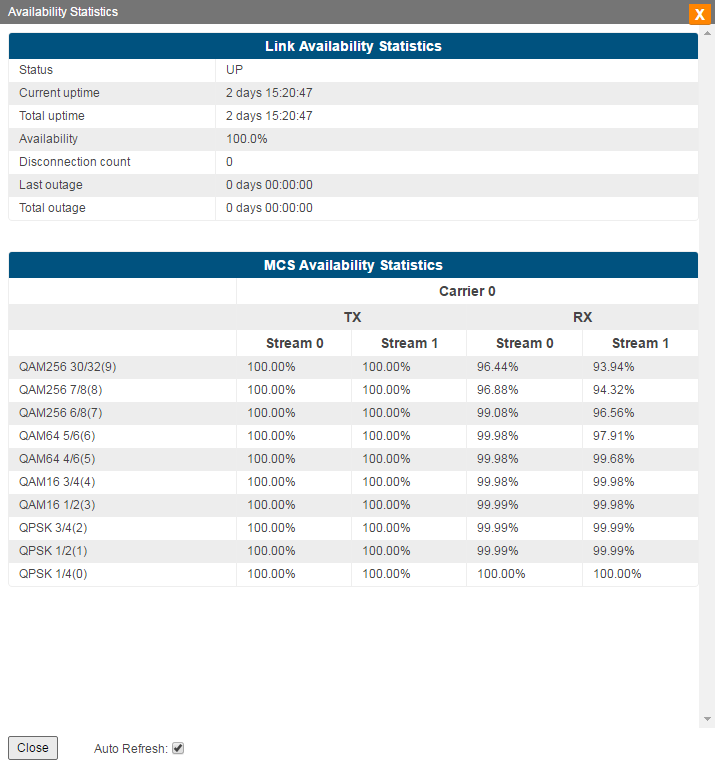 Image Added Image Added
|
|
On the bottom-right side of the "Status" page the «Clear All Counters» button is present with the scope of resetting the counter values to 0 when clicked on.
| Warning |
|---|
|
Clearing these counters by clicking on the «Clear All Counters» button means losing the history data about the functionality of your unit. Avoid this operation unless you are completely sure you don’t need this data in the future. |
The "Status" page has the following sections:
- "Interface Statistics" - displays the main parameters of all configured interfaces (physical and logical).
- "Wireless Link Statistics" - displays the main parameters of the radio link.
Interface Statistics
| Anchor |
|---|
| Interface Statistics |
|---|
| Interface Statistics |
|---|
|
| Center |
|---|
| Scroll Title |
|---|
| title | Table - Interface Statistics |
|---|
| | Parameter | Description |
|---|
| Port | - Displays all physical and logical set interfaces
| | Status | - Displays for each interface whether it is
|
“up running” | | Mode | - Displays the operation mode for the GE ports:
- 10,100 or 1000 Mbps and half or full duplex
| Packets Rx/Tx | - Displays the number of received and transmitted packets for each interface since the unit is operational or since the counters were last reset
| Errors Rx/Tx | - Displays the number of received and transmitted error packets for each interface since the unit is operational or since the counters were last reset
| Load (Kbps) Rx/Tx | - Displays the packet flow through each interface in real-time (for the system and the data traffic) expressed in Kbps
| Load (pps) Rx/Tx | - Displays the packet flow through each interface in real-time (for the system and the data traffic) expressed in packets per second (pps)
|
|
|
Additional statistics about the network packet types and error types for reception/transmission are displayed by clicking on any of the interfaces:
| Center |
|---|
| Scroll Title |
|---|
| title | Figure - Additional interface statistics |
|---|
| Image Removed | 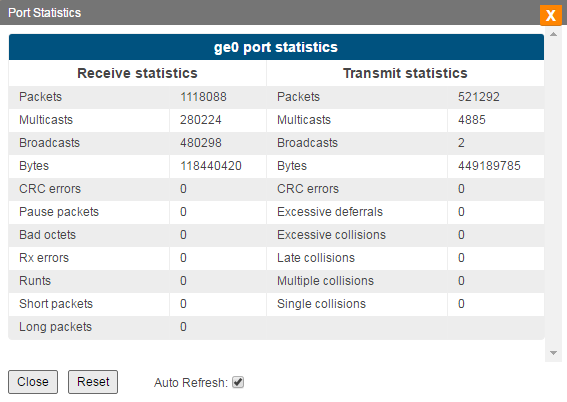 Image Added Image Added
|
|
Wireless Link Statistics
| Anchor |
|---|
| Wireless Link Statistics |
|---|
| Wireless Link Statistics |
|---|
|
This section is divided in the following two areas:
- "General radio link parameters" - displays the following information:
| Center |
|---|
The actual DL/UL ratio might different to the specified in the configuration because of air protocol limitations. The system automatically chooses the closest possible value to the requested one.| Scroll Title |
|---|
| title | Table - General radio link parameters |
|---|
| | Parameter | Description |
|---|
| Wireless Link Status | - Displays the status of the radio link which can be
|
“Up” or “Down” | | Measured Distance | - Displays the measured distance of the radio link in meters
|
If the remote end stats is disabled, the measured distance is only shown at the slave unit| Channel Width | - Displays the channel bandwidth that is in use
| | DL/UL Ratio | - Displays actual downlink/
|
uplin |
|
| Note |
|---|
|
- "Downlink" - data transmission from Master to Slave
- "Uplink" - data transmission from Slave to Master
| | Frame Period | |
|
|
- "Real time radio link status" - displays the following parameters of the radio link in real time for both the local and remote unit:
| Center |
|---|
| Scroll Title |
|---|
| title | Table - Wireless Links Statistics |
|---|
| | Parameter | Description |
|---|
| Tx capacity | - Displays the maximum transmission capacity expressed in Kbps for the current modulation and coding scheme
|
; if - . If the MCS changes, the Tx capacity will also change accordingly
| | Tx/Rx Frequency | - Displays the center Tx frequency expressed in MHz
| | DFS status | - DFS status information. Possible statuses:
- "NO_INIT" - utility is not initialized
- "DISABLED" - DFS is disabled
- "ENABLED" - DFS is enabled
- "FG_RADAR_SEARCH" - selected frequency scanning for radars existence
- "FG_RSSI_SCAN" - all available frequency grid noise level scanning
- "RADAR_FOUND" - radar found
- "RADAR_UP" - frequency with radar is blocked for selection
- "BG_RSSI_V" - "background" RSSI on the vertical channel
- "BG_RSSI_H" - "background" RSSI on the horizontal channel
- "BG_RDRDT_MAIN" - radar "background" searching on the main frequency
- "BG_RDRDT_ANNOUNCE" - radar "background" searching on the potential frequency
- "BG_FF_UL" - uplink frequency changing
- "BG_FF_DL" - downlink frequency changing
| | Tx/Rx Frames | - Displays the number of transmitted and received air frames
| | Rx Bad frames | - Displays the number of air frames received with errors for which the Control Block cannot be correctly decoded
| | Rx Acc FER | - Displays the Frame Error Ratio, meaning the percentage of frame loss (air frames that cannot be decoded divided by the total number of air frames received)
| | Tx parameters |
|---|
| MCS | - Displays the modulation and coding scheme that is in use at Tx side. There are
|
10 - 11 MCS schemes available and if the AMC is set to auto, the MCS will dynamically change its value based on the link quality (at both units - local and remote). The maximum Tx capacity varies based on the MCS in use.
- For example, for
|
QAM256 “QAM256” - “QAM256” is the modulation in use, “7/8” is the coding scheme in use (for every 7 data bits encoder produces 8 bits to be sent over the air) and “(8)” represents the index of the MCS in use
| | Power | - Displays the current power level of the Tx signal for each radio chain in dBm
| | Rx parameters |
|---|
| MCS | - Displays the modulation and coding scheme that is in use at Rx side. The representation is similar to that for Tx part
| | CINR | - Displays Carrier to Interference and Noise Ratio measured in downlink and expressed in dB
- CINR can be limited either due to too low signal level or because of the interference from other radios
- AMC algorithm makes its decisions based on the CINR value
- Higher CINR is better
| | RSSI | - Displays the Received Signal Strength Indicator measured in downlink and expressed in dBm
- Represents the power of the received signal as a whole (useful signal plus noise and interferences) and if it goes below the level of the sensitivity, the link will go down
| | Acc TBER | - Displays the Transport Block Error Ratio, showing the percentage of errored transport blocks
- Each application has an acceptable air block error rate defined as a minimum requirement
- The values are presented in the table below
|
|
|
...
For the InfiLINK XG 1000 family models the real time radio link parameters are displayed for both radio modules. |
CINR and RSSI parameters
CINR and RSSI are very important in analyzing the link performance. Below there are the guidelines
...
for CINR and RSSI levels:
| Center |
|---|
| Scroll Title |
|---|
| title | Table - CINR and RSSI value ranges |
|---|
| | Scroll Title |
|---|
title| Comment | bgcolor | | - Very low quality signal suitable for low-order modulations only. It is highly recommended to improve signal quality by selecting less congested channel or increasing signal level
|
| Background Color |
|---|
| | - Low signal quality, average modulations are available
|
| Background Color |
|---|
bgcolor | | - Very good quality signal suitable for highest-order modulations
|
|
|
| Center |
|---|
| Table - | value rangesRSSI | Comment | | -90…-80 | - Close to the receiver sensitivity level, suitable only for the lowest modulation levels; it is highly recommended to improve signal level or switch to narrower available channel width in order to avoid the loss of connectivity
| | -80…-60 | | | -60…-40 | - The recommended range for achieving best performance
| | >-40 | - Input signal level is too high, it is recommended to decrease the Tx power in order to avoid possible damage of the radio module of the remote unit
|
|
|
The maximum Tx capacity varies based on the MCS in use. The table below specifies the relation between the MCS and the maximum capacity:
| Center |
|---|
| Scroll Title |
|---|
| title | Table - InfiLINK XG throughput capabilities (laboratory figures) |
|---|
| | Channel width | 10 MHz | 20 MHz | 40 MHz |
|---|
| Air frame period | 1 ms | 10 ms | 1 ms | 10 ms | 1 ms | 10 ms |
|---|
| Modulation, coding rate | Throughput, Mbps |
|---|
| QAM256 30/32 | 98 | 119 | 200 | 241 | 435 | 477 | | QAM256 7/8 | 92 | 110 | 186 | 225 | 401 | 440 | | QAM256 3/4 | 78 | 94 | 159 | 192 | 343 | 377 | | QAM64 5/6 | 65 | 77 | 132 | 159 | 284 | 312 | | QAM64 2/3 | 51 | 61 | 105 | 126 | 226 | 249 | | QAM16 3/4 | 38 | 45 | 77 | 94 | 168 | 185 | | QAM16 1/2 | 24 | 29 | 51 | 61 | 110 | 121 | | QPSK 3/4 | 17 | 21 | 37 | 45 | 81 | 89 | | QPSK 1/2 | 11 | 12 | 24 | 29 | 52 | 57 |
|
|
The minimum TBER requirement for specific applications:
| Center |
|---|
| Scroll Title |
|---|
| title | Table - Acceptable error rates for different applications |
|---|
| | Application | Acceptable error rate |
|---|
| TCP-based applications (web, FTP, etc.) | 10-4 | | Voice-over-IP | 10-5 | | UDP video (CCTV, IPTV, etc) | 10-6 | TDM-over-IP | 10-7...10-9 |
|