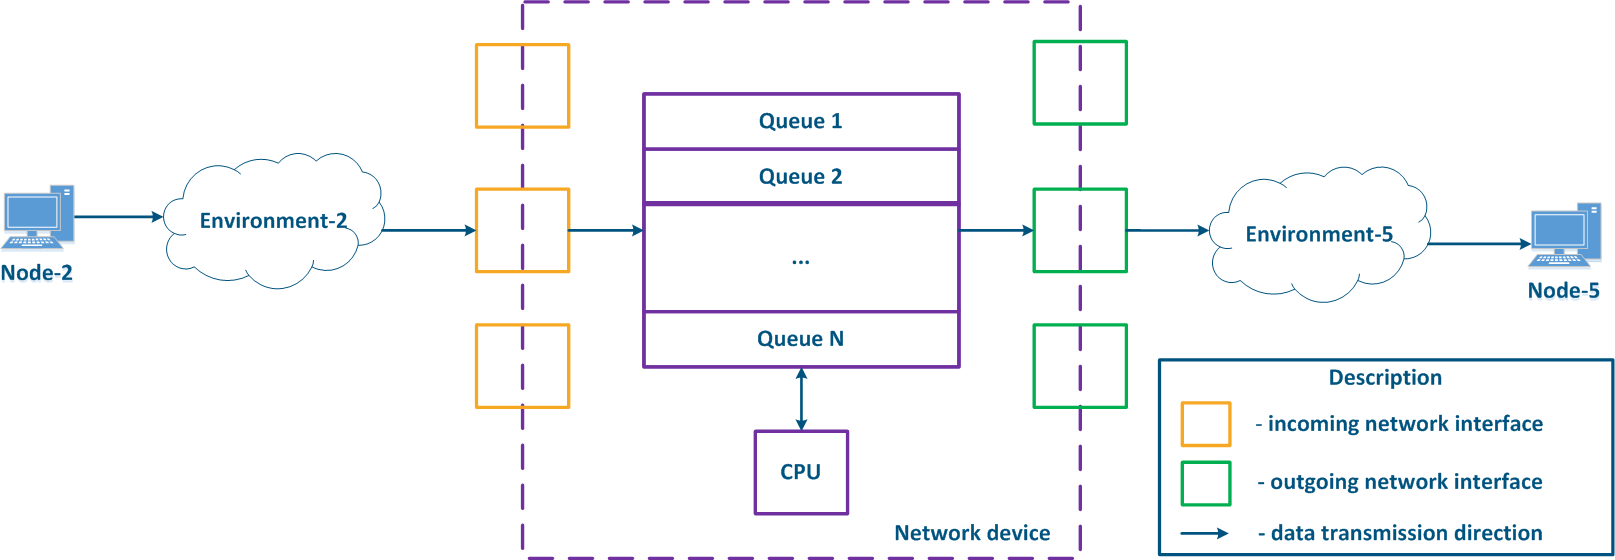
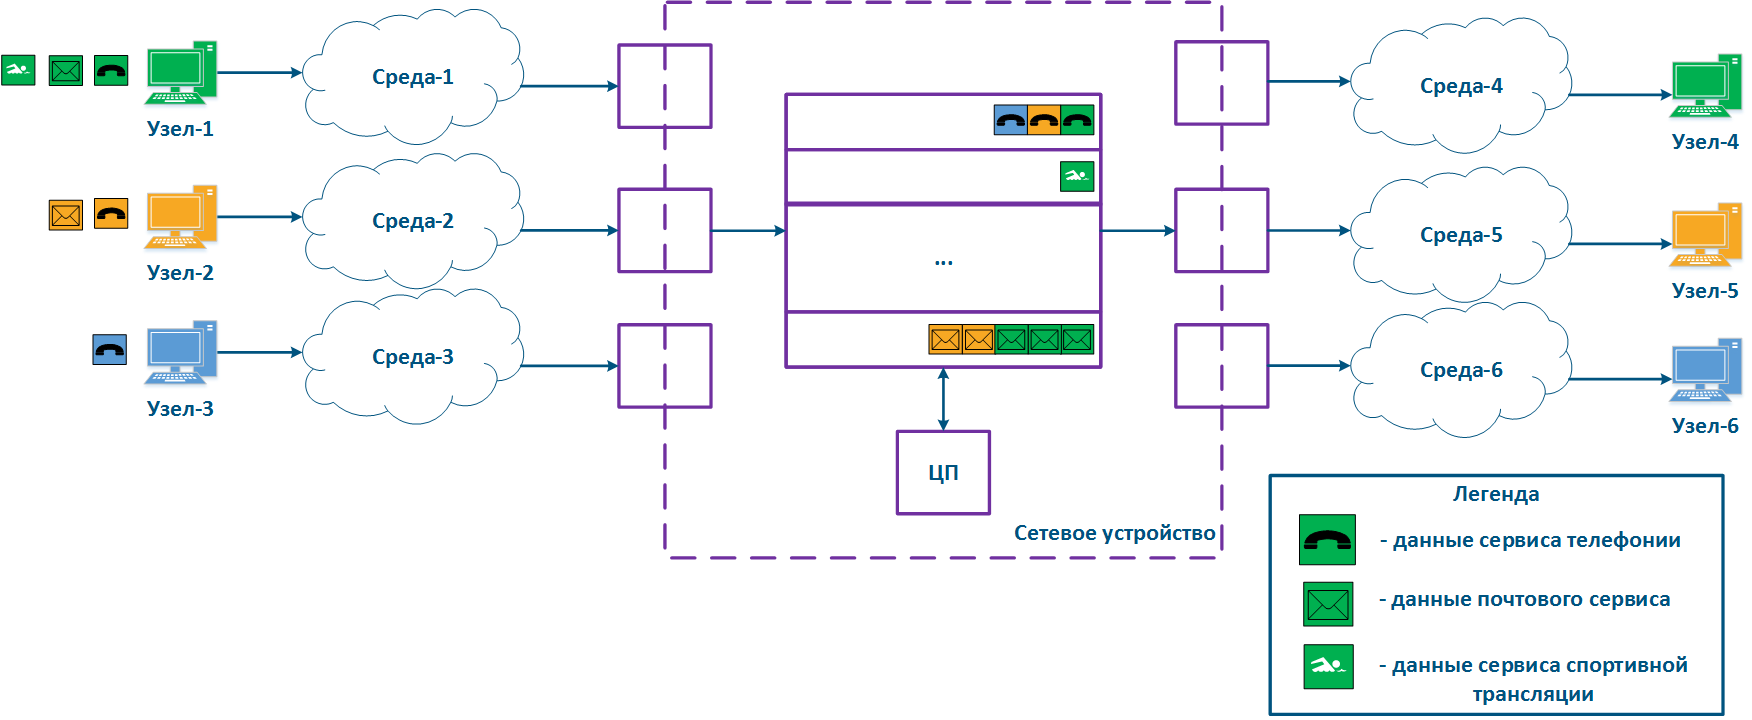
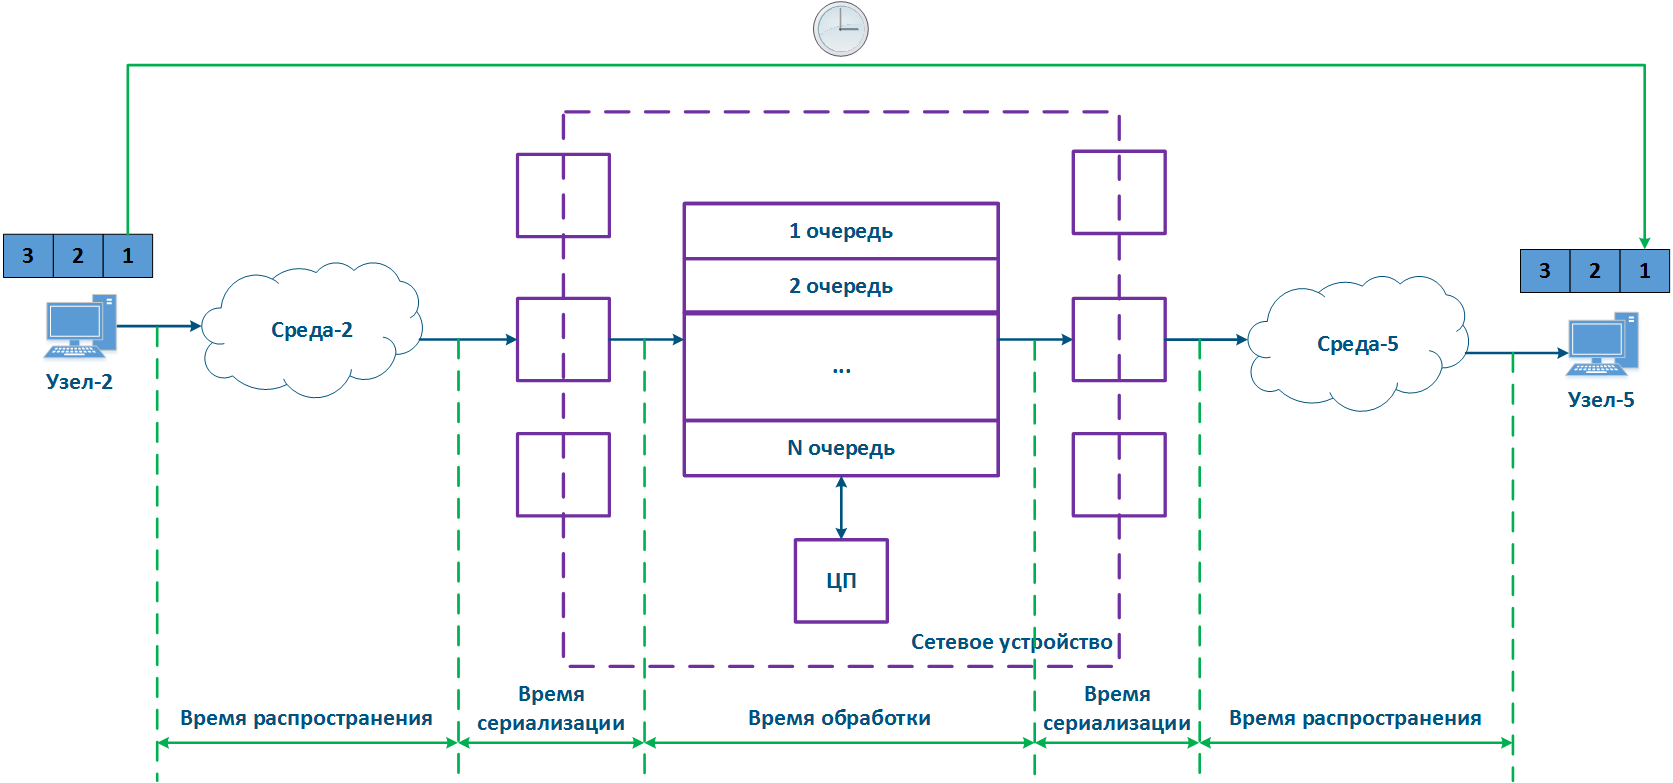
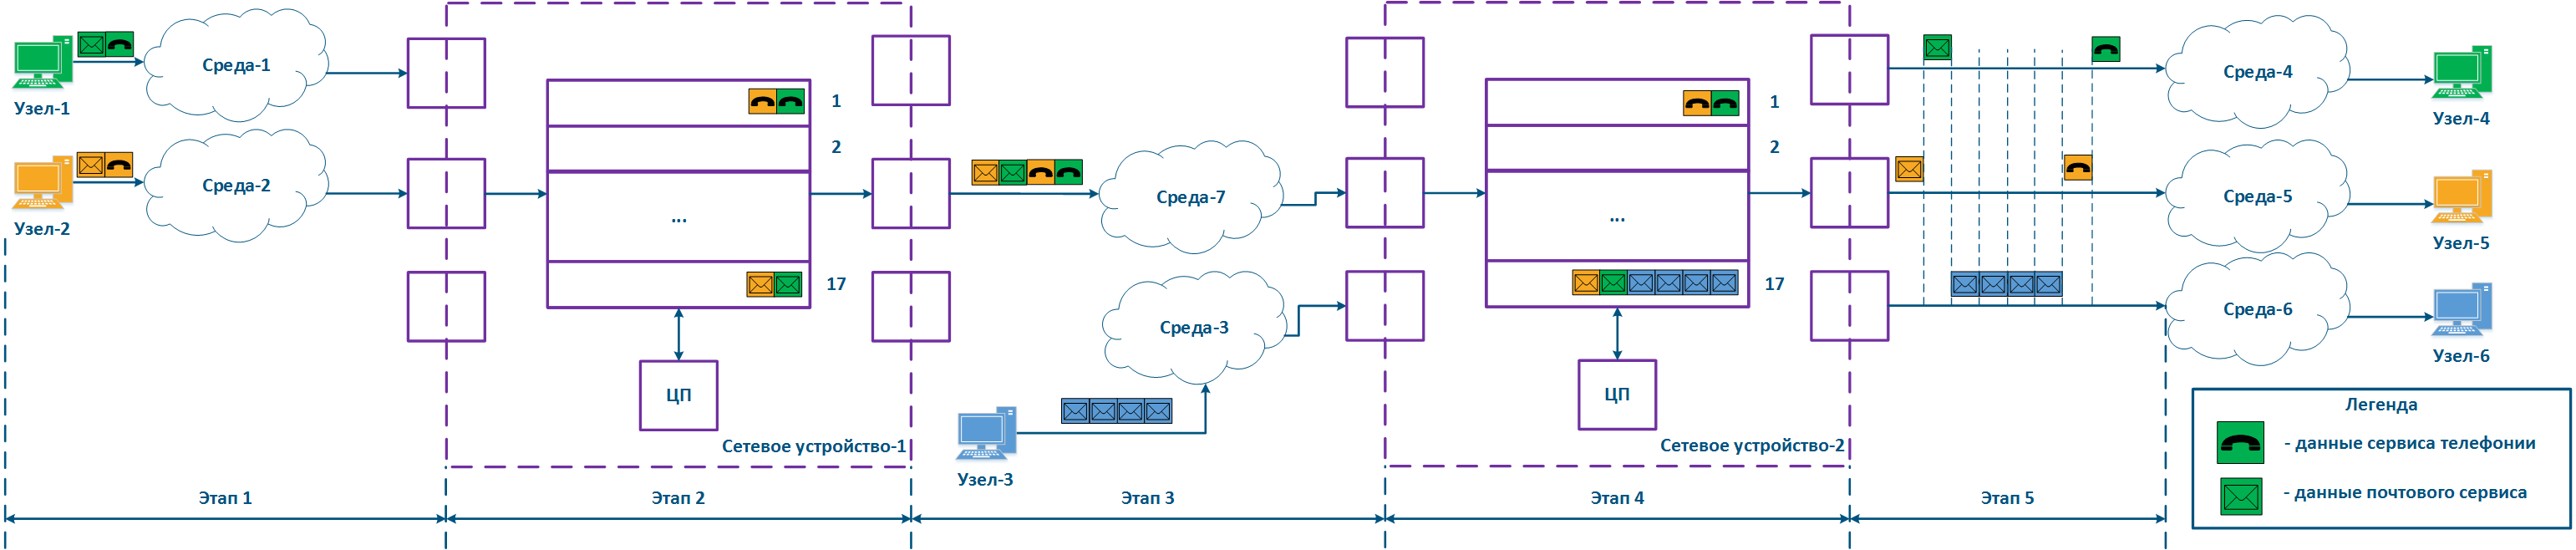
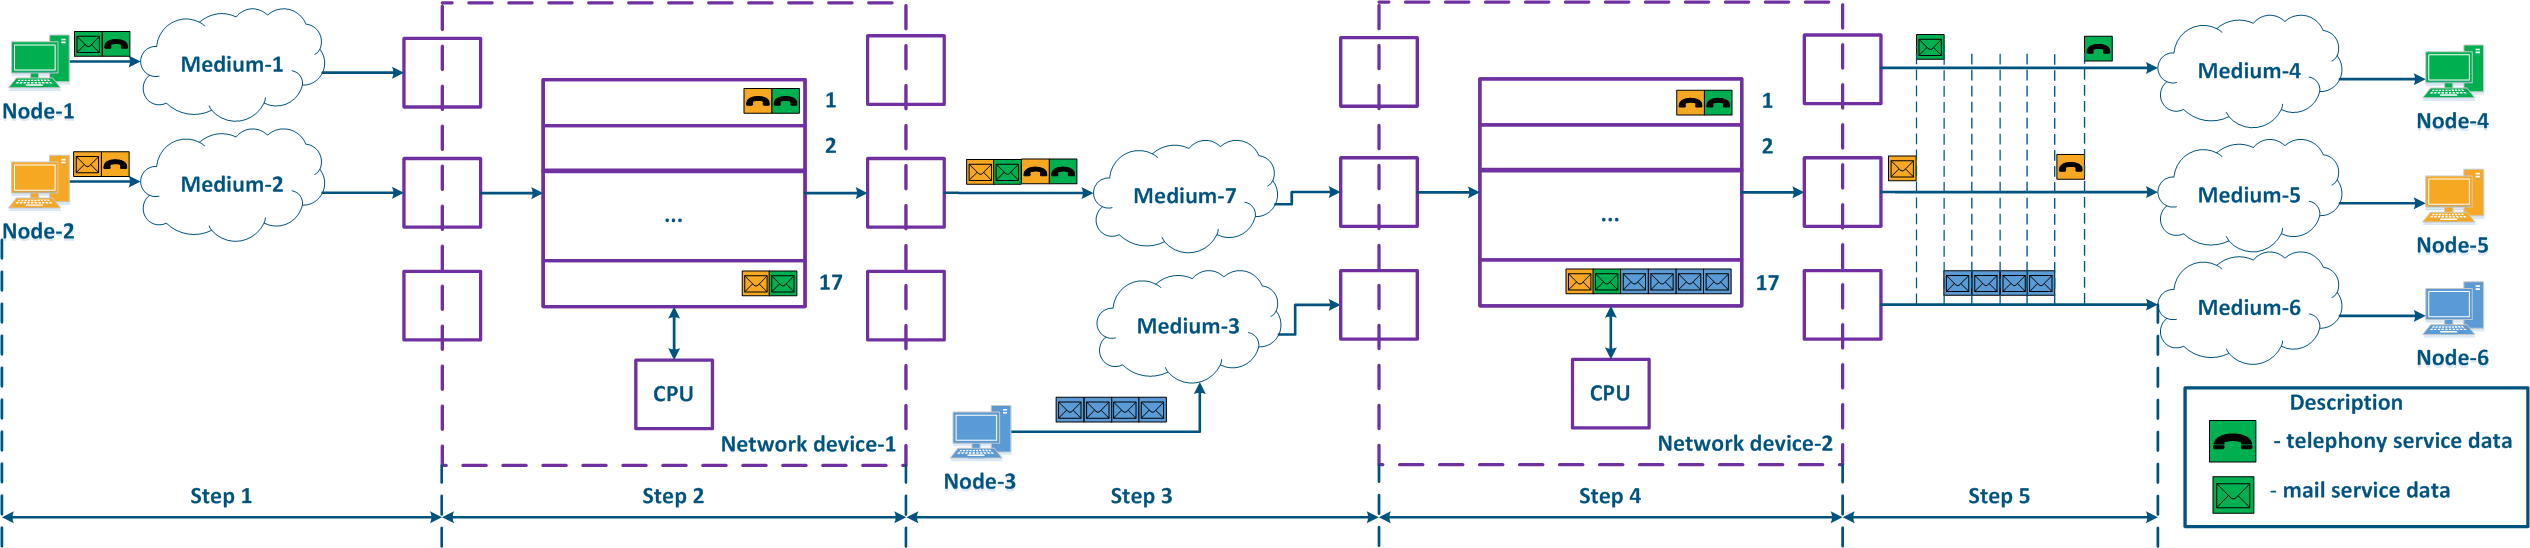
...
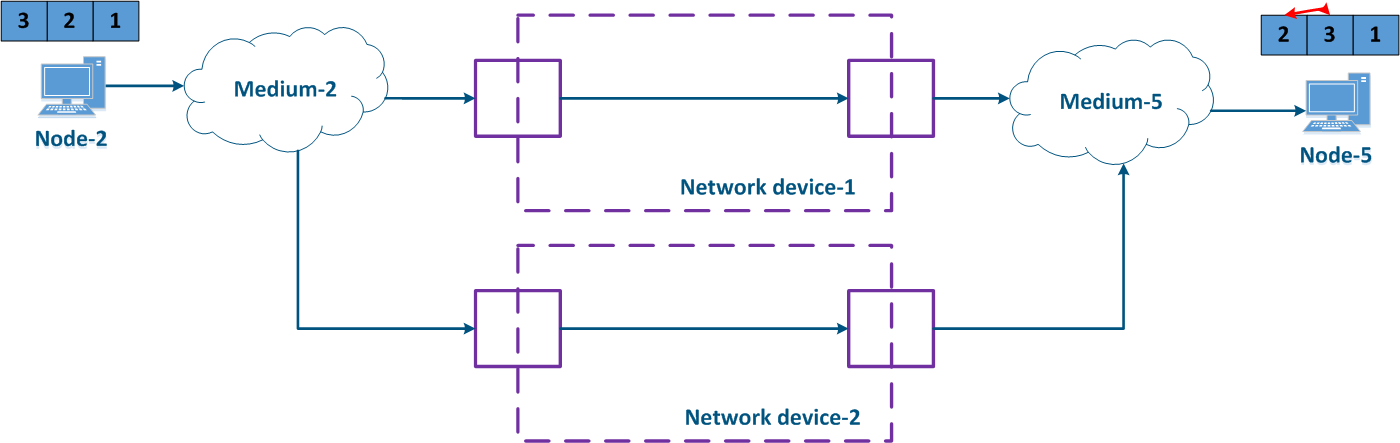
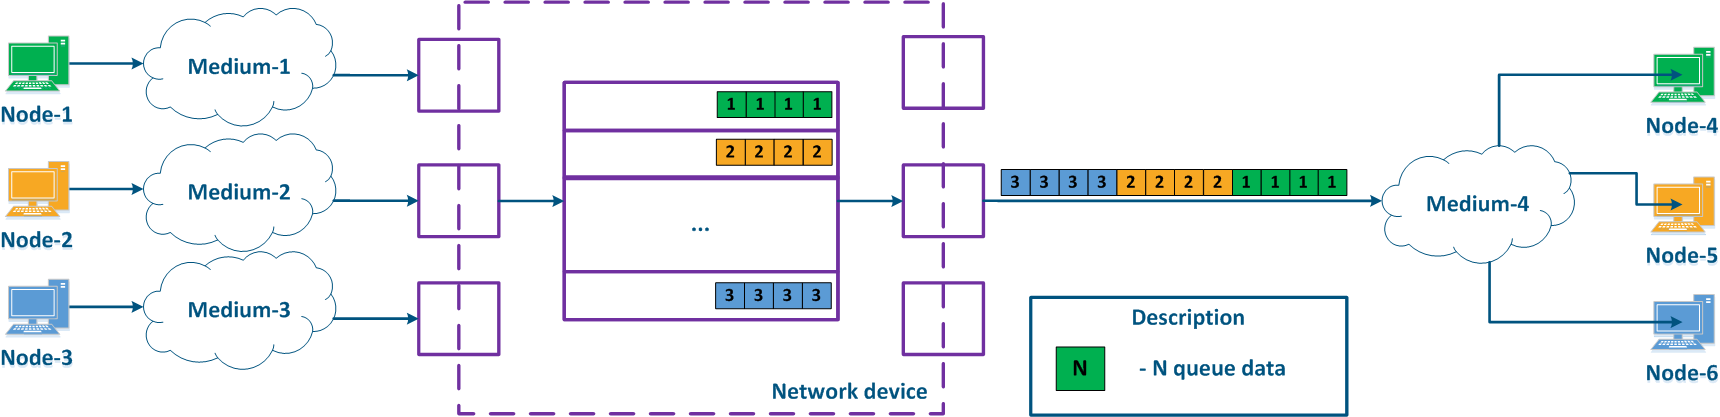
Note, in the modern network devices, network interfaces mostly are combined and can operate as both incoming and outgoing.
| Center |
|---|
Figure 1 - A network device traffic passing scheme |
...
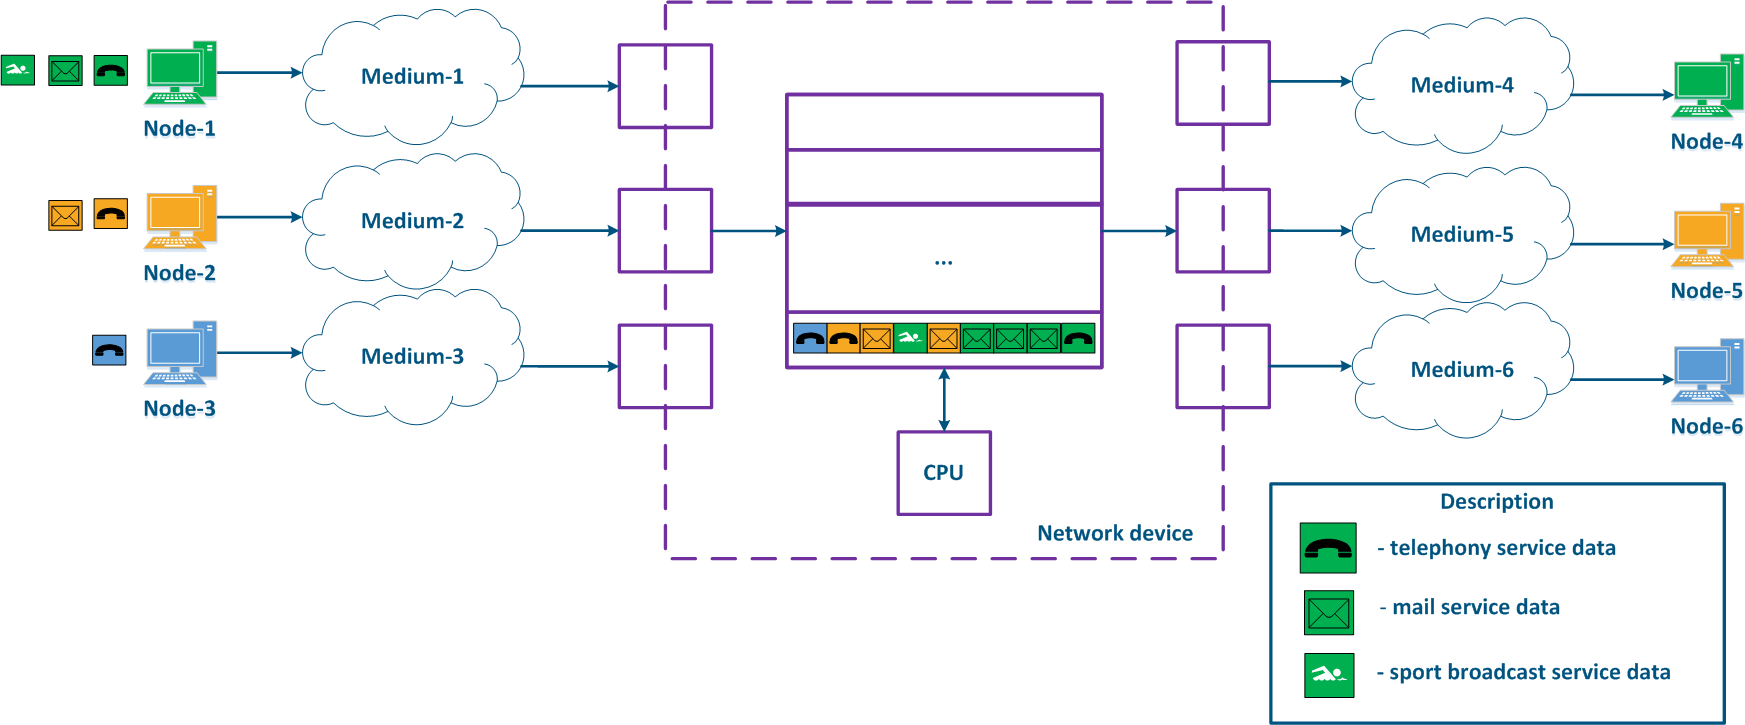
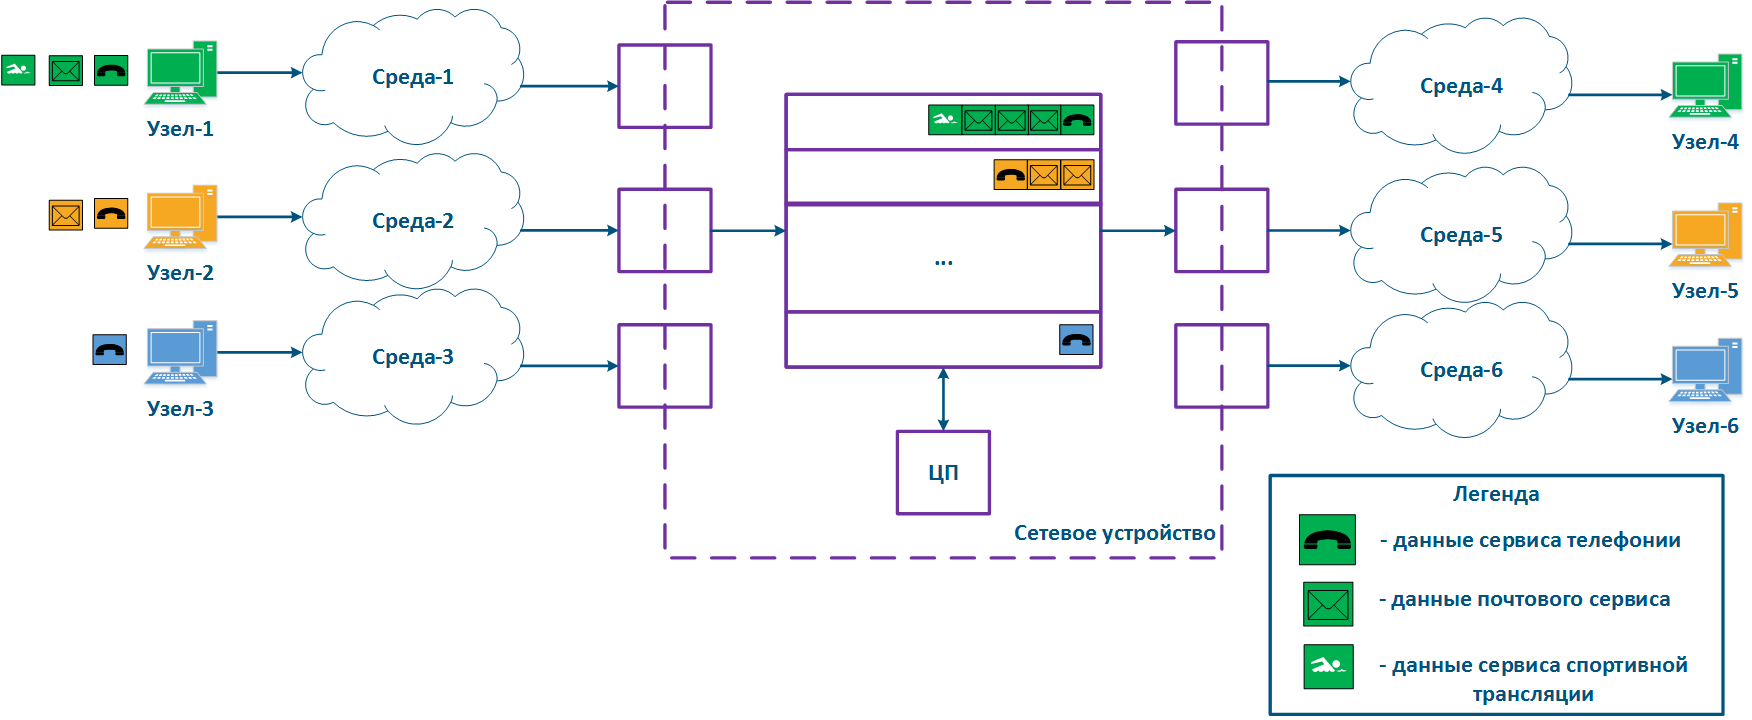
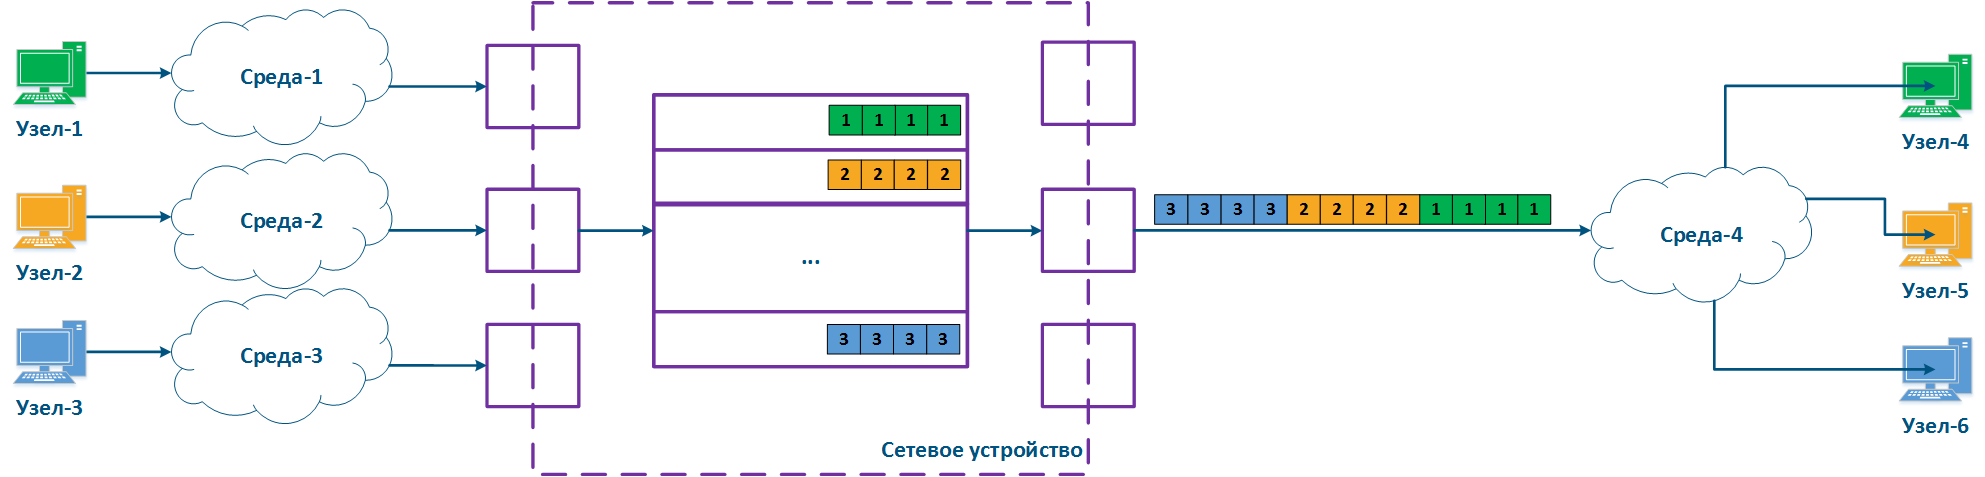
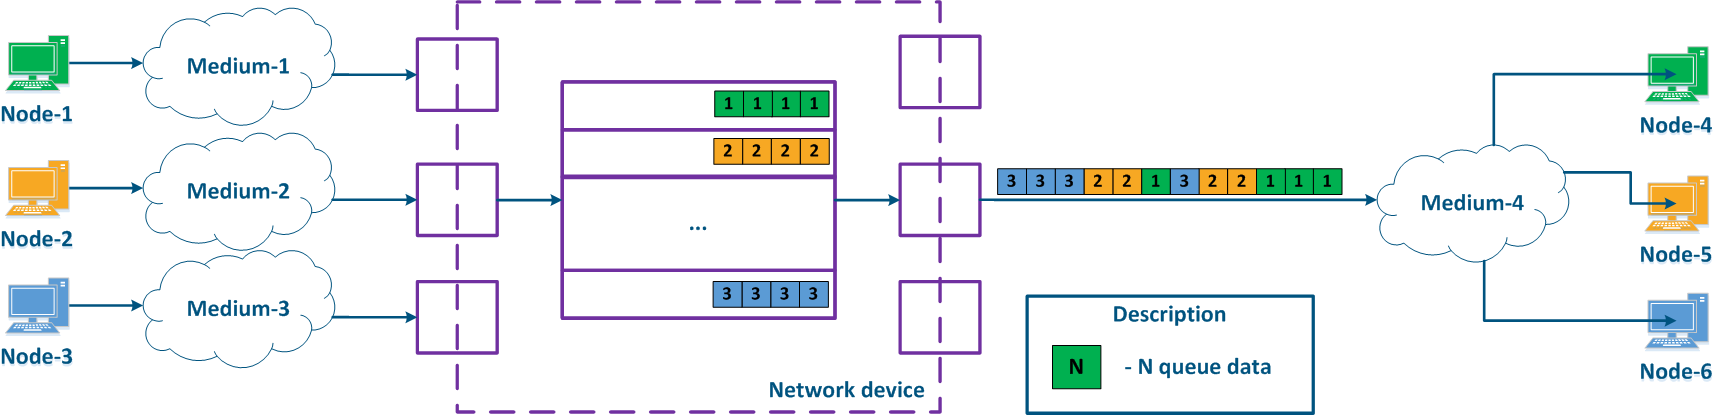
With QoS configured, each of the incoming traffic flows can be classified by its type (for example) and map a separate queue to each class (Figure 2b). Each packet queue can be assigned a priority, which will be taken into account during packets extraction from queues, and will guarantee quality indicators. The traffic flows classification can be performed not only by the services used, but according to other criteria. For example, each pair of nodes can be assigned a separate message queue (Figure 2c).
| Center |
|---|
Figure 2a - Queuing for various services without QoS
Figure 2b - Queuing for various services with QoS
Figure 2b - Queuing for various users with QoS |
...
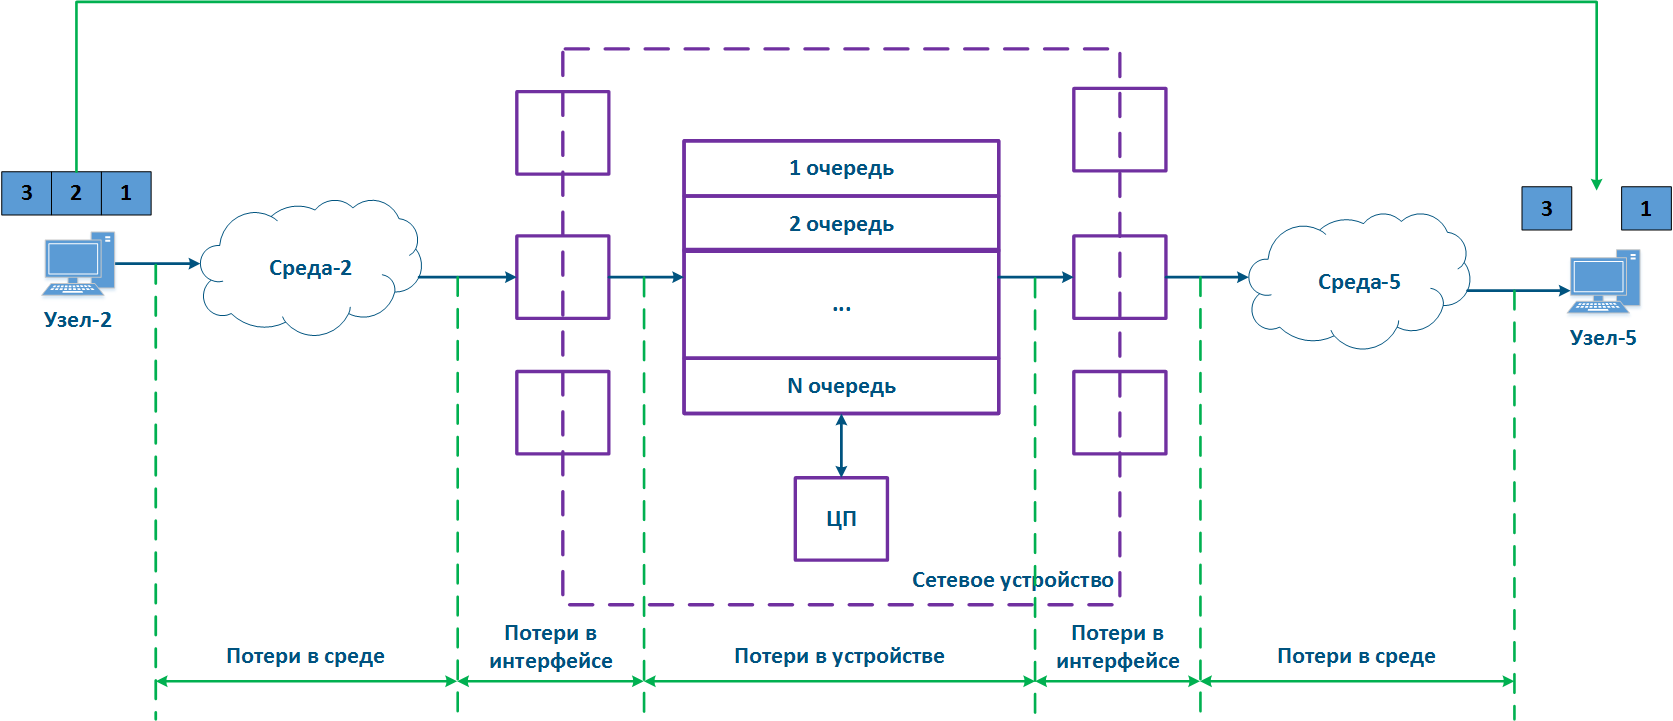
The causes of data loss can be divided into the following groups:
- Losses in the medium: losses related with signal propagation in the physical environment. For example, the frame will be lost if the useful signal level is lower than the receiver sensitivity. Losses can also be caused by physical damage of the interfaces connected to the media or by impulse pickups resulting from poor grounding.
- Losses on the interface: losses during processing a queue on incoming or outgoing interface. Each interface has a memory buffer, which can be completely filled in case of intensive data stream. In this case, all subsequent data entering the interface will be discarded, because cannot be buffered.
- Losses in the device: Data discarded by the network device according with configuration logic. If the queues are full and the incoming data cannot be added to the processing queue, the network device will drop it. Also, these losses include data packets rejected by access lists and a firewall.
| Center |
|---|
Figure 3 - Data packet loss example |
...
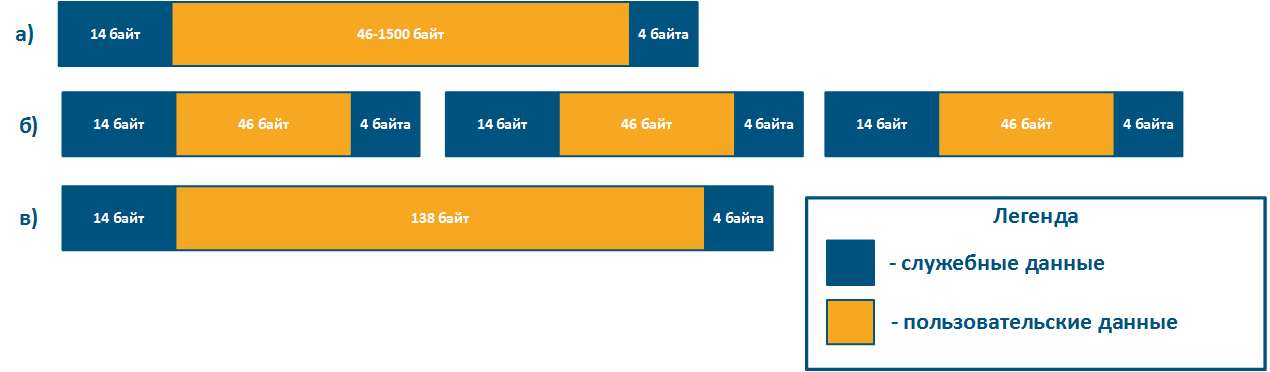
For example, the service header length for frames 64 bytes long (Figure 4b) and 156 bytes (Figure 4c) will be the same, but the user data amount will be different. To transmit 138 bytes of user data, three frames 64 bytes long or one frame 156 bytes long will be required, so in the first case 192 bytes are needed, in the second - 156 bytes. If link has the same throughput, large frames will increase efficiency by rising the useful throughput of the system. The Infinet devices performance values in various conditions is shown in the "Performance of the InfiNet Wireless devices" document.
| Center |
|---|
Figure 4 - Examples of various lengths Ethernet frame structure |
...
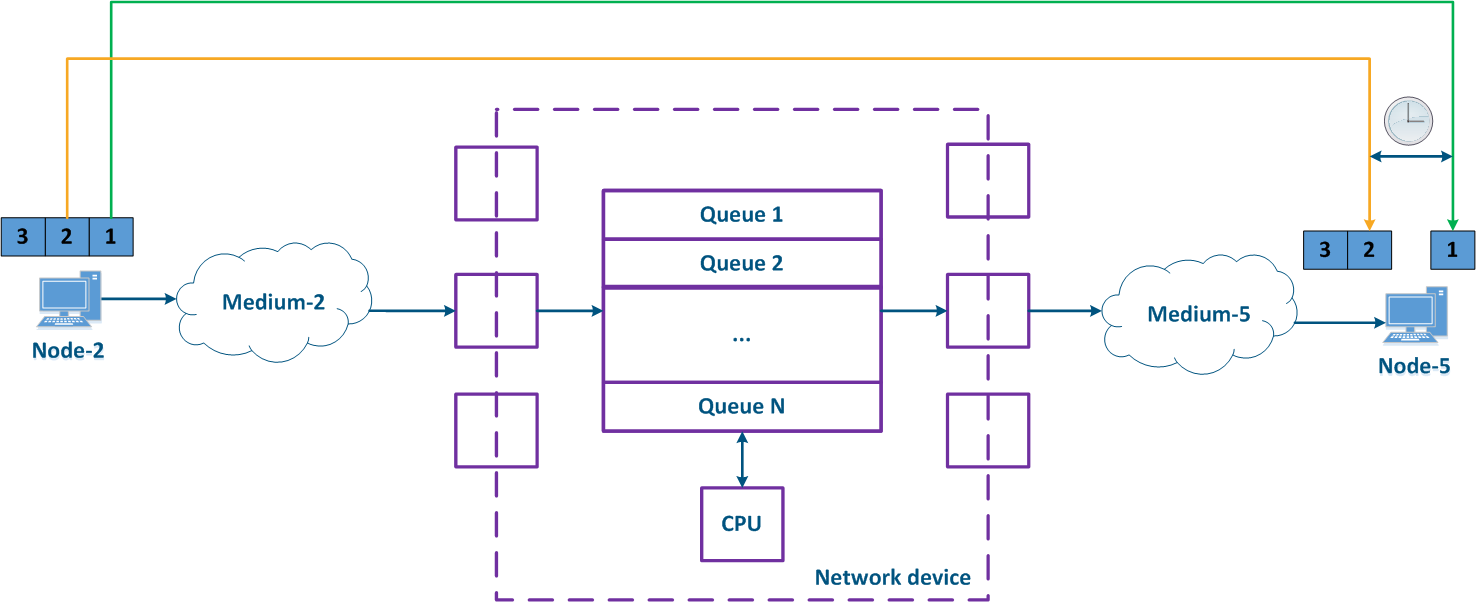
The delay is often measured, as a round-trip time (RTT), i.e. the time it takes for the data packet to be transmitted from a source to a destination and backward. For example, this value is used in the ping command results. The state of intermediate network devices during processing the data packets forward and backward may differ, therefore, usually the round-trip time is not equal to two one-way delays.
| Center |
|---|
Figure 5 - Example of data transfer delay |
...
CPU loading and the packets queues status on intermediate network devices are frequently changing, so the delay during data packets transmission can change. In the example (Figure 6), the transmission time of packages with identifiers 1 and 2 is different. The difference between the maximum and average delay values is called jitter.
| Center |
|---|
Figure 6 - Example of floating delay in data transfer |

...
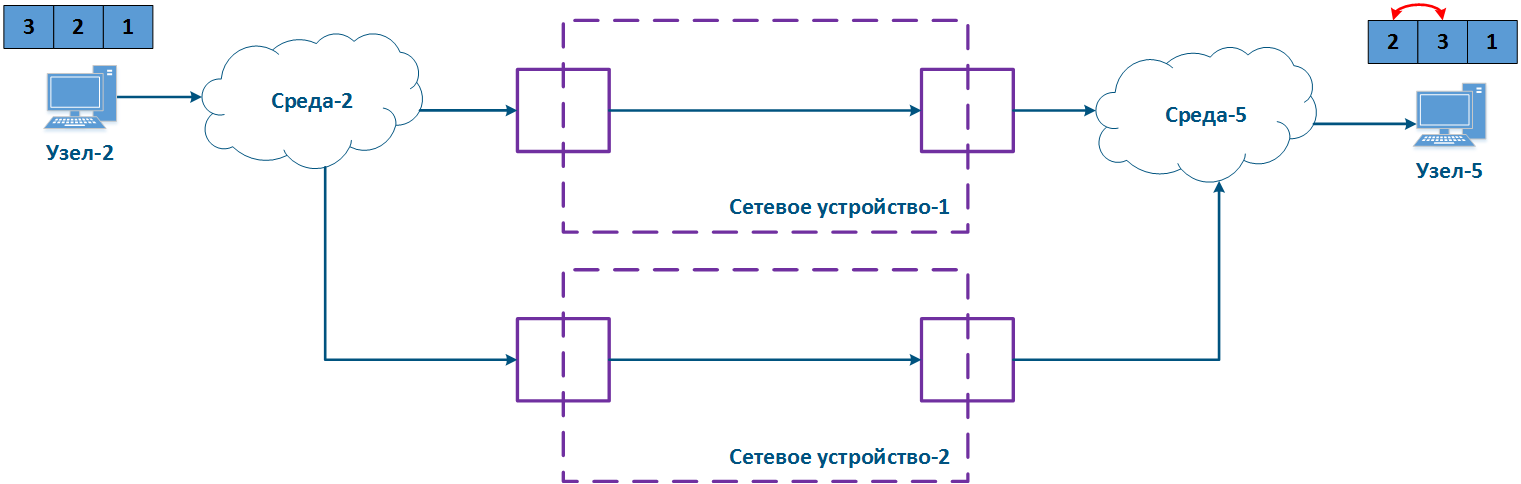
The effect depends on the service characteristics and the ability to restore the original sequence by higher levels network protocols. For example, if the traffic of different services is transmitted through different paths, then it will not affect the disorder of the received data.
| Center |
|---|
Figure 7 - Example of unordered data delivery |
...
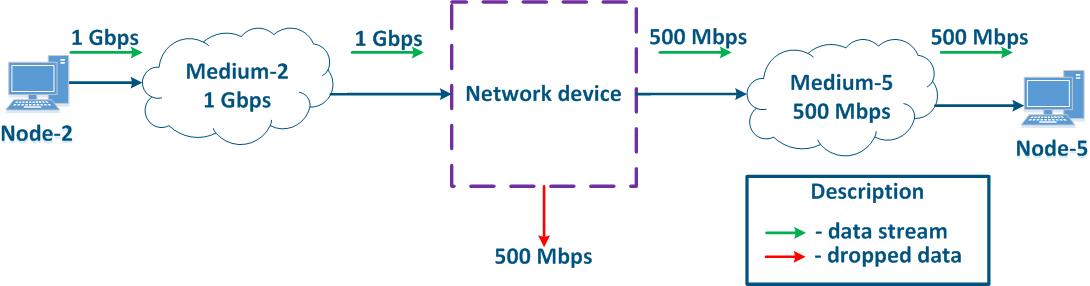
Let's look at the example (Figure 8), Node-2 generates several services traffic with a total speed of 1 Gbit/s, Environment-2 allows to transfer this data stream to an intermediate network device, however, the maximum link throughput between network device and Node-5 is 500 Mbps. Obviously, the data stream cannot be processed completely and part of this stream must be dropped. The QoS task is to make this drops manageable to provide the end services the required metric values. Of course, it is impossible to provide the required performance for all services, as links throughputs do not match, therefore, the QoS policy implementation involves that critical services traffic should be processed first.
| Center |
|---|
Figure 8 - Example of inconsistency in incoming traffic amount and links throughputs |

...
Keep in mind that implementing QoS policies is only one component to ensure quality metrics. For maximum effect, the QoS configuration should be synchronized with other settings. For example, using TDMA technology instead of Polling on InfiLINK 2x2 and InfiMAN 2x2 family devices reduces jitter by stabilizing the delay value (see TDMA and Polling: Application features).
| Center |
|---|
Figure 9a - Example of data distribution with partly implemented QoS policy
Figure 9b - Example of data distribution with implemented QoS policy |
...
- White-box: all network devices in the data propagation path are in the same responsibility zone. In this case, the QoS configuration on the devices can be synchronized, in accordance with the requirements described in the section above.
- Black-box: some network devices in the data propagation path are in a external responsibility zone. The classification rules for incoming data and the algorithm for putting out packets from queues are configured individually on each device. The architecture of packets queues implementation depends on the equipment manufacturer, therefore there is no guarantee of the correct QoS configuration on devices in external responsibility zone, and as a result, there is no guarantee of the high-quality performance indicators.
| Center |
|---|
Figure 10a - White-box structure example
Figure 10b - Black-box structure example |
...
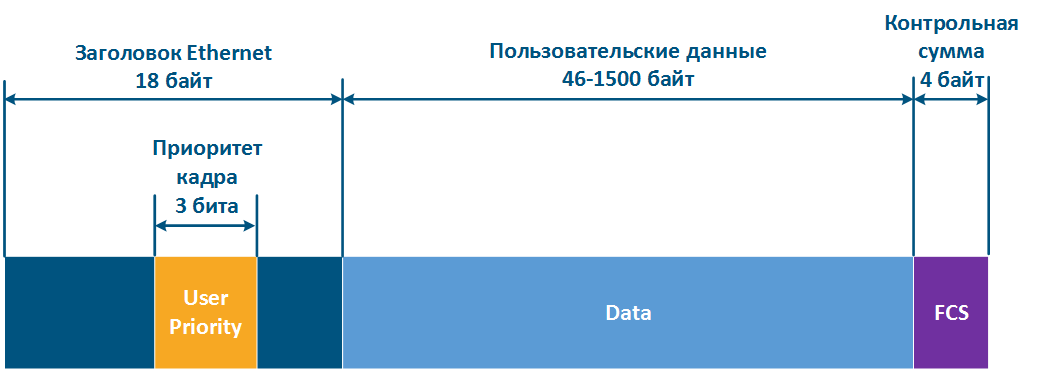
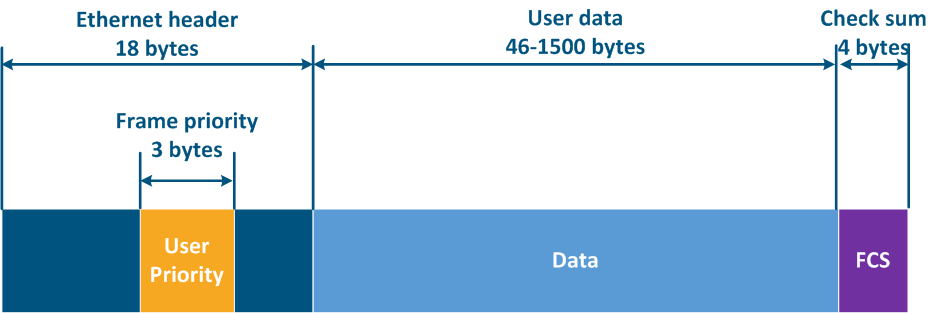
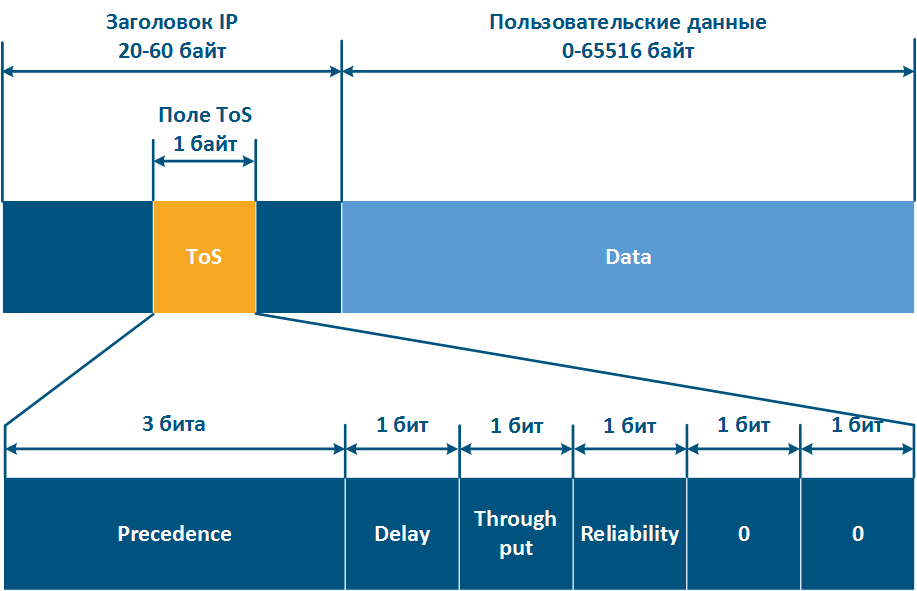
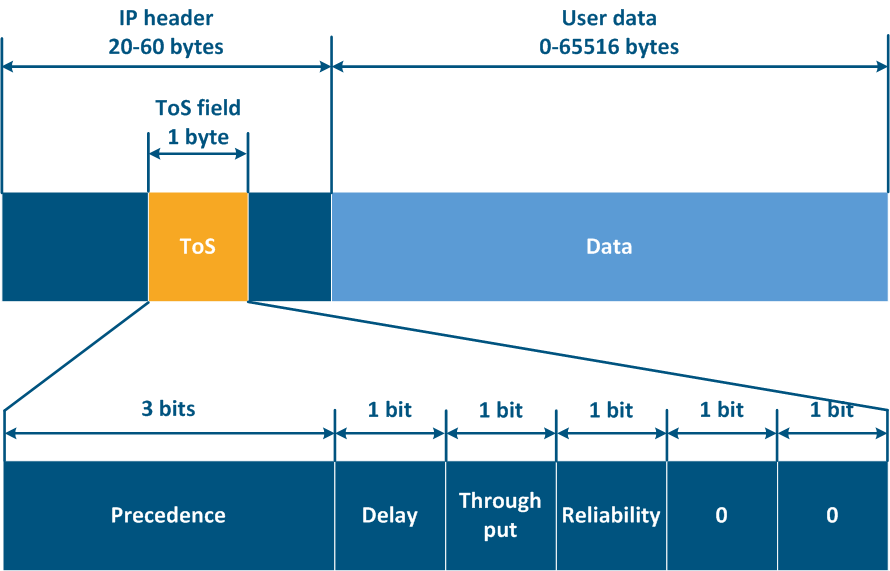
The Ethernet frame header includes the "User Priority" service field, which is used to prioritize data frames. The field has a 3 bits size, which allows to select 8 traffic classes: 0 class - the lowest priority, 7 class - the highest priority.Keep in mind that the "User Priority" field is only in 802.1q frames, i.e. tagged with the VLAN tag.
| Center |
|---|
Figure 11 - Frame prioritization service field in Ethernet header |
...
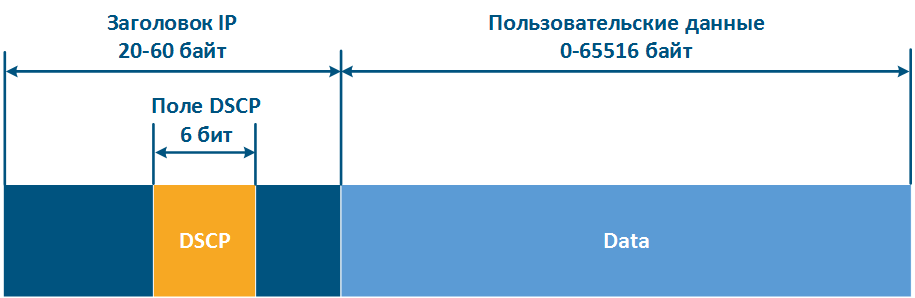
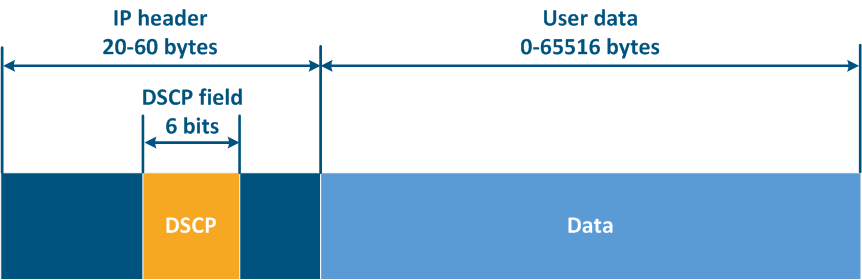
Thus, ToS allows to distinguish 8 traffic classes: 0 - the lowest priority, 7 - the highest priority, and DSCP - 64 classes: 0 - the lowest priority, 63 - the highest priority.
| Center |
|---|
Figure 12a - ToS service field in IP packet header
Figure 12b - DSCP service field in IP packet header |
...
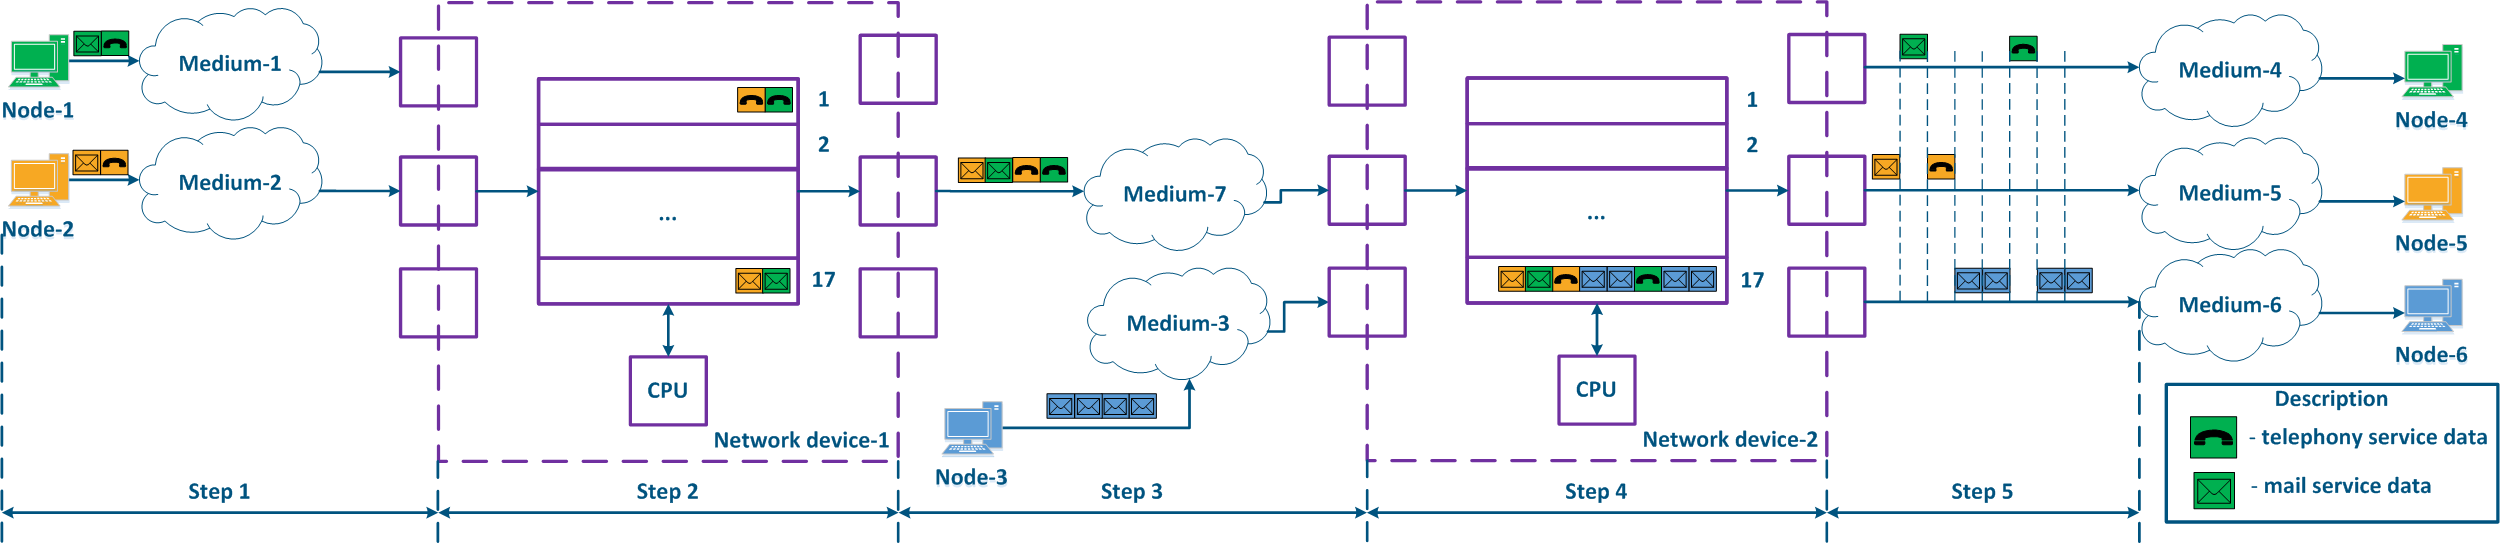
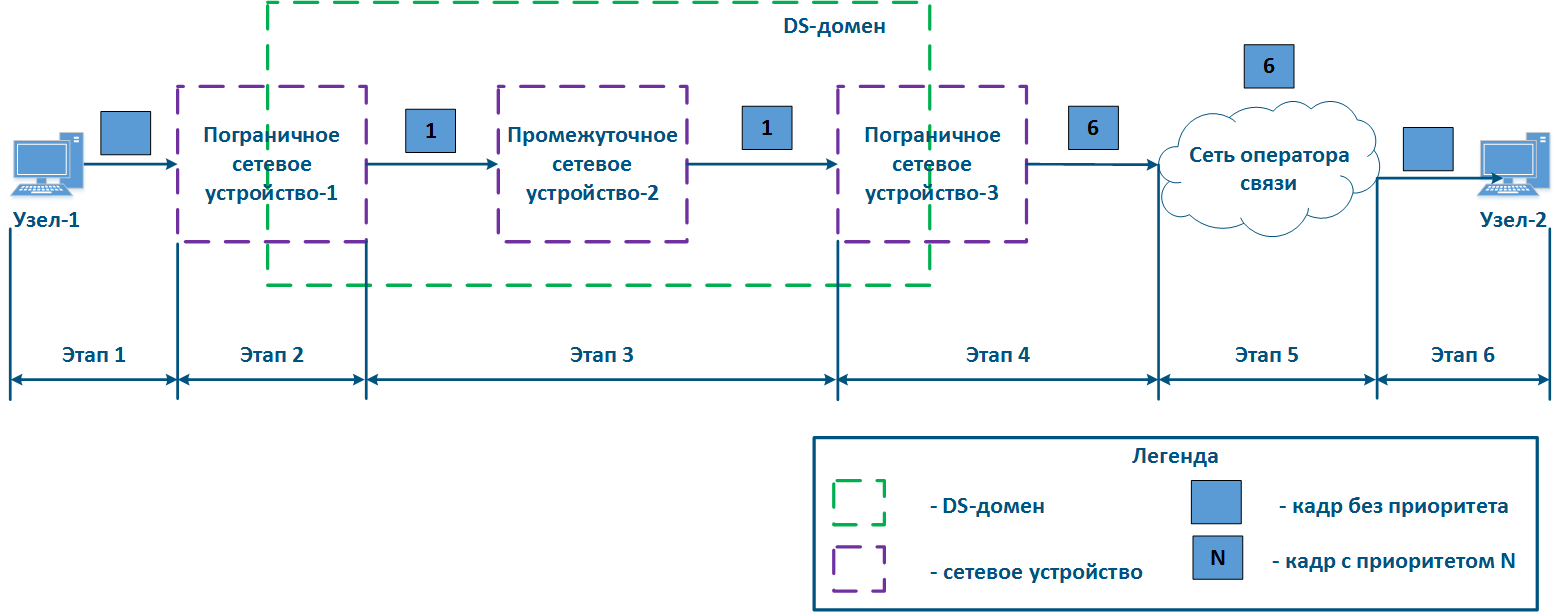
- Step 1: Node-1 generates an Ethernet frame for Node-2. There is no field for frame priority tag in the header (Figure 13a).
- Step 2: Border Network Device-1 changes the Ethernet header, setting the priority to 1. Border devices should have configured rules to select Node-1 traffic from the general stream so necessary priority is set only to these frames. In networks with a large traffic flows number, the list of rules on border devices can be volumetric. Border network device-1 processes the frame in accordance with the set priority, placing it in the corresponding queue. The frame is transmitted to the outgoing interface and sent to the Intermediate network device-2 direction (Figure 13a).
- Step 3: Intermediate network device-2 receives an Ethernet frame with priority 1, and places it in the corresponding queue. The device does not manipulate with setting/removing priority in the frame header. The frame is transmitted towards the Border network device-3 (Figure 13a).
- Step 4: The border network device-3 processes the incoming frame similarly as Intermediate device-2 (see Step 3) and transmits it to the provider network (Figure 13a).
- Step 4b: in case of agreement that traffic will be transmitted through the provider network with a priority other than 1, then the Border Device-3 must perform a priority change. In this example, the device changes the priority value from 1 to 6 (Figure 13b).
- Step 5: during the frame transmission through the provider network, the devices are guided by the priority value in the Ethernet header (Figure 13a).
- Step 5b: similarly to Step (Figure 13b).
- Step 5c: in there is no agreement about frames prioritization in accordance with the priority value specified in the Ethernet header, a third-party service provider can apply its own QoS policy to traffic and set a priority that may not satisfy the QoS policy of the DS domain (Figure 13c).
- Step 6: the border device in the provider network removes the priority field from the Ethernet header and passes it in the Node-2 direction (Figure 13a-c).
| Center |
|---|
Figure 13a - Example of the Ethernet frame priority changing during transmission through two network segments (priority in segments is coordinated)
Figure 13b - Example of the Ethernet frame priority changing during transmission through two network segments (priority in segments is coordinated, but should be changed)
Figure 13c - Example of the Ethernet frame priority changing during transmission through two network segments (priority in segments is not coordinated) |


...
The lack of this mechanism is that resources will not be allocated to low-priority traffic if there are packets in higher priority queues, it will lead to the complete inaccessibility of some network services.
| Center |
|---|
Figure 14 - Strict packets scheduling |
...
When using weighted scheduling, each queue will receive resources, i.e. there will be no situation with the complete inaccessibility of some network service.
| Center |
|---|
Figure 15 - Weighted packets scheduling |

...
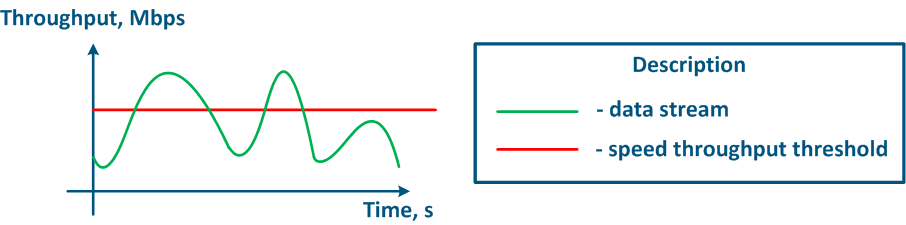
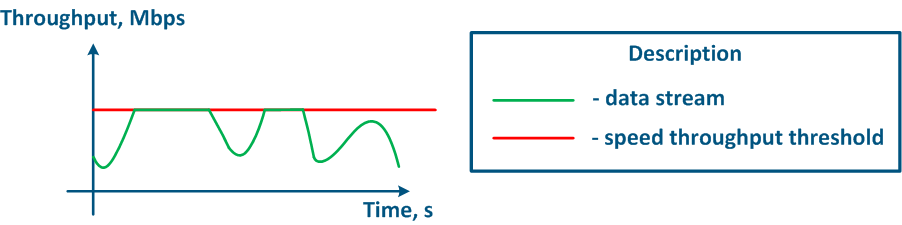
The throughput limitation principle is to constantly measure the data stream intensity and apply the restrictions if the intensity value exceeds the set threshold (Figure 16a,b). The throughput limitation in Infinet devices is performed in accordance to the Token Bucket algorithm, all data packets above the throughput threshold are discarded. As a result the losses described above appears.
| Center |
|---|
Figure 16a - Graph of unlimited data flow rate
Figure 16b - Graph of limited data flow rate |
...
In the example (video 1), the speed limit is 3 data units, the buffer size is 12 data units. The buffer is constantly replenished in accordance with the threshold, however, it cannot be filled over its own volume.
| Center | ||||
|---|---|---|---|---|
|
Data received by the device inbound interface will be processed only if the buffer contains resources for their processing (video 2). Thus, the passing data empties the buffer resource. If the buffer is empty at the time of data arrival, the data will be discarded.
| Center | |
|---|---|
| Multimedia | |
| TokenBucket_2.mp4 | |
| width | 100% |
...
Despite the described advantage of the Token Bucket algorithm, the average throughput will fit to the set threshold, as in the long time period, the resources amount will be determined not by the size of the buffer, but by the intensity of its filling, which is equal to the throughput threshold.
| Center | |
|---|---|
| Multimedia | |
| TokenBucket_3.mp4 | |
| width | 100% |
...
In this example, two speed limit rules are implemented: for vlan 161 traffic - 3 data units per time block, for vlan 162 traffic - 2 data units. The buffer size for each traffic flow contains 4 time intervals, i.e. 12 data units for vlan 161 traffic and 8 data units for vlan 162 traffic. Totally 5 data units are allocated to the buffers in each time interval, then the allocated resources are distributed between the buffers. Since the buffers size is limited, resources which exceeds their size cannot be used.
| Center | |
|---|---|
| Multimedia | name | TokenBucket_4.mp4
| width | 100% |
The each buffer resources can only be used for traffic of the corresponding service (video 5). Thus, to handle vlan 161 traffic, a resources of buffer for vlan 161 traffic are used. Similarly, buffer resources are used for vlan 162 traffic.
| Center | ||||||
|---|---|---|---|---|---|---|
Video 5 - Dedicated resources for data processing using |
...
In the example, the buffer for vlan 162 traffic is full, it allows to fill in the vlan 161 traffic buffer with 5 selected data units, instead of 3. In this case, the vlan 161 service throughput will increase. But when vlan 162 traffic resource buffer will have free space, resource allocation will return to normal mode: for vlan 161 traffic - 3 data units, for vlan 162 traffic - 2 data units.
| Center | |
|---|---|
| Multimedia | |
| name | TokenBucket_6.mp4 | width | 100%
Video 6 - Allocated resources redistribution between various services traffic limitation buffers |
...