...
| Center |
|---|
| Scroll Title |
|---|
| title-alignment | center |
|---|
| title | Table - Interface Statistics |
|---|
| | Parameter | Description |
|---|
Interface | - Displays all physical and logical set interfaces
| | MAC Address | - Displays the MAC address of each interface
| | Status | - Displays for each interface whether it is “up and running” or not
| | Mode | - Displays the operation mode of each interface. For example and half or full duplex for the Ethernet interface
- Bitrate, frequency and bandwidth for the Radio interface, DFS status
- Switch Group number for the SVI
- ;
- Half or full duplex mode - red value of this parameter informs that transmission is performed in a half-duplex mode.
- Radio interface:
- Bitrate;
- Operating frequency - red value of this parameter indicates an absence of data transmission due to the spectrum scanning by the DFS tool;
- Channel width;
- TX Power - red value for this parameter may indicate a problem with the transceiver's hardware.;
- DFS tool state;
- Greenfield mode.
- SVI:
- PRF interface:
- Parent;
- Channel number;
- Frame size - red value of this parameter means impossibility to set the optimal size due to external limitation (MTU value on the switch port).
- Vlan interface:
- Parent;
- Vlan ID;
- Selected vlan interface operation standard.
| | Packets | - Displays the number of received and transmitted packets for each interface since the unit is operational. The local system packets are counted, too (and not only the ones that are passing through the switching groups - data traffic)
| | Errors | - Displays the number of received and transmitted error packets for each interface since the unit is operational
| | Load | - Displays the packet flow through each interface in real-time (for the system and the data traffic)
|
|
|
...
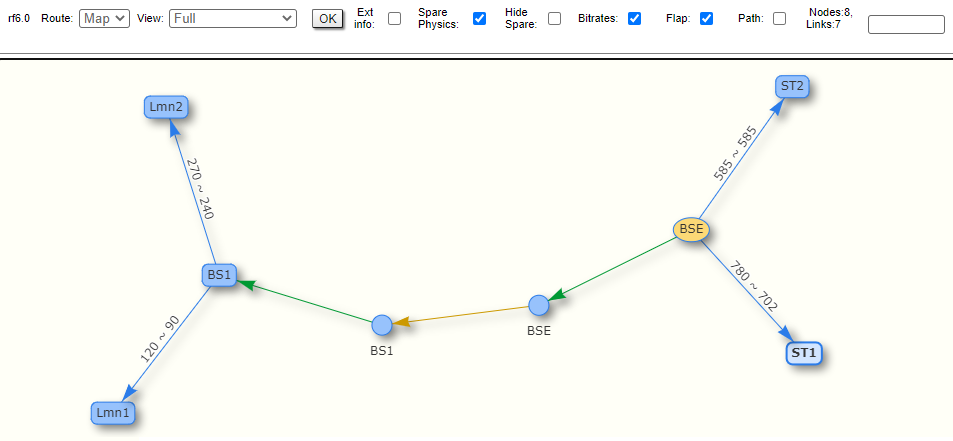
Schematic topology map allows you to visually determine the network connectivity and complexity and to track the route switching, including mobile objects.
...
The radio interfaces of the Masters devices are marked with a rectangle, the Slaves are marked with ellipses. The device name highlighted in red indicates problems in its operation. Connections are represented by arrows pointing the prevailing direction of data transfer. Arrows have the following color differences:
- Blue - wireless connection, thicker the line, the higher a load on the link.
- Yellow - PRF connection.
- Green - join connection between radio and prf interfaces.
- Red - indicates the interruptions of the link.
Dashed lines represent backup routes.
| Center |
|---|
| Scroll Title |
|---|
| title-alignment | center |
|---|
| title | Figure - Schematic map |
|---|
| 
|
|
For additional information on each node, double click on it to get remote commands (rcmd).
...
| Center |
|---|
| Scroll Title |
|---|
| title-alignment | center |
|---|
| title | Figure - Extended Interface Statistics |
|---|
| 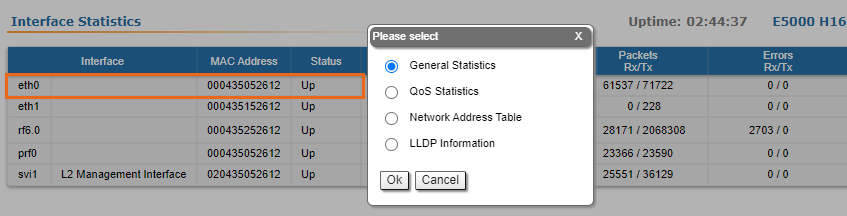 Image Removed Image Removed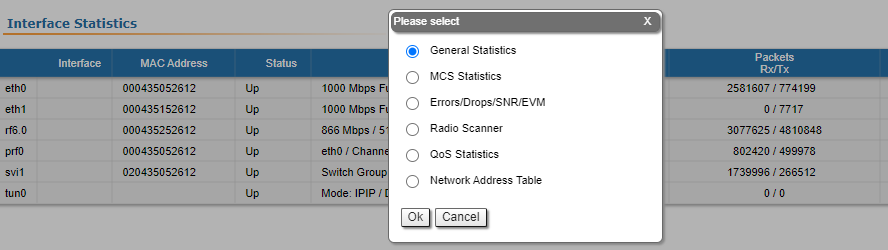 Image Added Image Added
|
|
General Statistics
...
For Ethernet interfaces information about current status, operational mode and load statistics is available.
| Center |
|---|
| Scroll Title |
|---|
| title-alignment | center |
|---|
| title | Figure - General Statistics Ethernet |
|---|
| 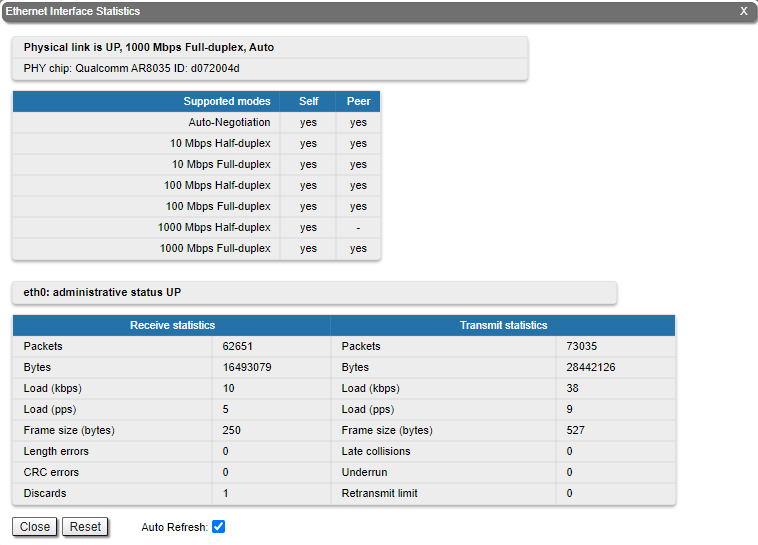 Image Removed Image Removed
|
|
Rx and Tx statistics parameters:
...
CRC errors
...
Total frames received with a CRC error
...
Length errors
...
Total abnormal length frames received
...
Transmit statistics
...
Packets
...
The total number of transmitted packets
...
Bytes
...
The sum of lengths of all good Ethernet frames sent
...
Late collisions
...
The number of times a collision is detected later than 512 bits-times into the transmission of a frame
...
Underrun
...
The number of times the transmitter's packet processing rate exceeded the switch capabilities
...
For the pseudo-radio interface information about parent interface, MTU value and load statistics is available.
| Center |
|---|
| Scroll Title |
|---|
| title-alignment | center |
|---|
| title | Figure - General Statistics PRF |
|---|
| 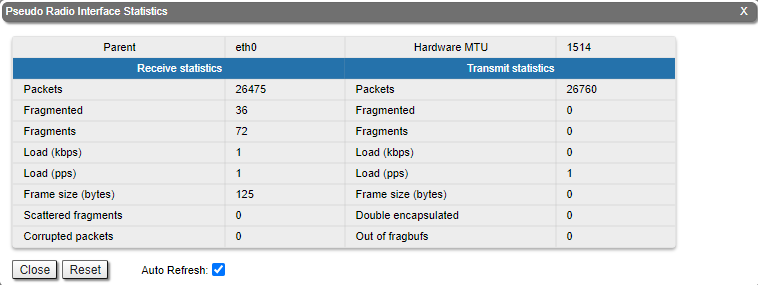 Image Removed Image Removed
|
|
For the SVI interface information about current status, RX and TX staistics is available.
| Center |
|---|
| Scroll Title |
|---|
| title-alignment | center |
|---|
| title | Figure - General Statistics SVI |
|---|
| 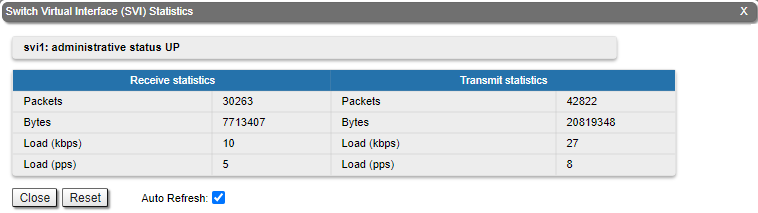 Image Removed Image Removed
|
|
operational mode and load statistics is available.
| Center |
|---|
| Scroll Title |
|---|
| title-alignment | center |
|---|
| title | Figure - General Statistics Ethernet |
|---|
| 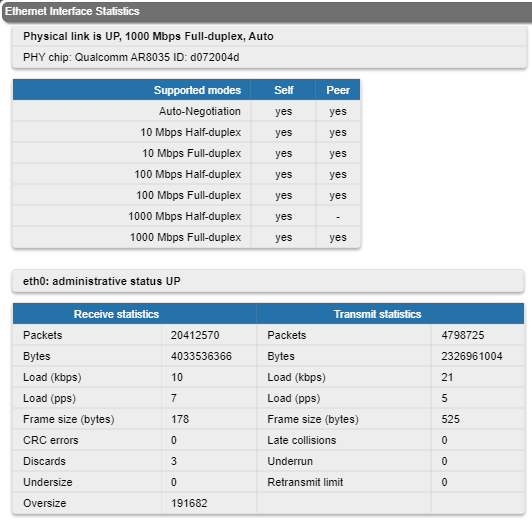 Image Added Image Added
|
|
Rx and Tx statistics parameters:
| Center |
|---|
| Parameter | Description |
|---|
| Receive statistics | | Packets | The total number of received packets | | Bytes | The sum of lengths of all good Ethernet frames received | | Load (kbps) | The link load, Kbit/s | | Load (pps) | The link load, packets per second | | Frame size (bytes) | The frame size in bytes | CRC errors | Total frames received with a CRC error | | Discards | Number of dropped frames | | Undersize | Number of received too short packets | | Oversize | Number of received too long packets | Transmit statistics | Packets | The total number of transmitted packets | Bytes | The sum of lengths of all good Ethernet frames sent | | Load (kbps) | The link load, Kbit/s | | Load (pps) | The link load, packets per second | | Frame size (bytes) | The frame size in bytes | Late collisions | The number of times a collision is detected later than 512 bits-times into the transmission of a frame | Underrun | The number of times the transmitter's packet processing rate exceeded the switch capabilities | | Retransmit limit | Packets dropped due to queue overflow |
|
For the radio interface information about current status, DFS mode and load statistics is available.
| Center |
|---|
| Scroll Title |
|---|
| title | Figure - General Statistics RF |
|---|
| 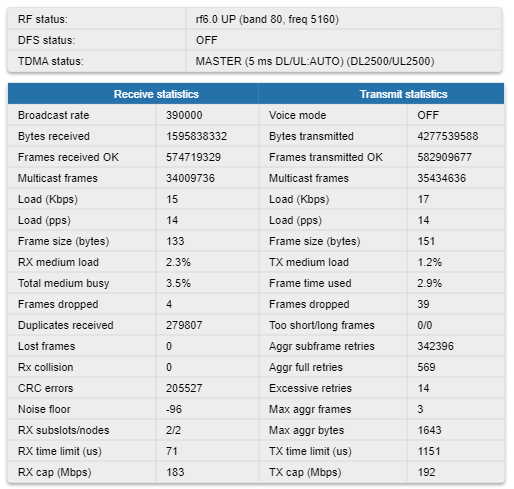 Image Added Image Added
|
|
Rx and Tx statistics parameters:
| Center |
|---|
| Parameter | Description |
|---|
| Receive statistics | | Broadcast Rate | Current Bitrate for broadcast and multicast frames on the BS depends on the speed of the slowest subscriber | | Bytes Received | Number of received bytes including headers | | Packets Received OK | Number of correctly received packets | | Multicas frames | Number of received multicast frames | | Load (kbps) | The link load, Kbit/s | | Load (pps) | The link load, packets per second | | Frame size (bytes) | The frame size in bytes | | RX Medium Load | Time spent on receivin d g frames (%) | | Total Medium Busy | The total time medium was busy (both DL and UL) (%) | | Frames dropped | The number of dropped frames | | Duplicate Received | The number of duplicate frames received | | Lost frames | The number of lost frames | | RX collision | The number of frames damaged in the receiving channel | | CRC Errors | Total frames received with a CRC error | | Noise Floor | Input noise level. Measurement cycle –10 seconds | | RX subslots/nodes | Frame subslots number allocated for received data / number of subscribers | | RX time limit | Payload for incoming traffic, ms | | Rx Cap (Mbps) | Throughput limit for UL (Mbps) | Transmit statistics | Voice Mode | Voice mode ON/OFF value. If turned ON, the mode of voice traffic prioritized processing is turned on | | Bytes Transmitted | Number of transmitted bytes including headers | | Packets Transmitted OK | Number of correctly transmitted packets | | Multicas frames | Number of transmitted multicast frames | | Load (kbps) | The link load, Kbit/s | | Load (pps) | The link load, packets per second | | Frame size (bytes) | The frame size in bytes | | TX Medium Load | Time spent on transmitting frames (%) | | Frame Time Used | Average loading of frame (%) | | Frames dropped | The number of dropped frames | | Too short/long frames | Number of frames dropped due to length: too short/long | | Aggr Subframe Retries | Number of packet drops in an aggregate due to protocol excesses | | Aggr Full Retries | Number of duplicate aggregates transmitted | | Excessive Retries | Number of packets which were not transmitted with maximal number of retries | | Max aggr frames | Maximal detected number of packets in an aggregate | | Max aggr bytes | Maximal detected bytes in an aggregate | | RX time limit | Payload for transmitted traffic, ms | | Tx Cap (Mbps) | Throughput limit for DL (Mbps) |
|
For the pseudo-radio interface information about parent interface, MTU value and load statistics is available.
| Center |
|---|
| Scroll Title |
|---|
| title | Figure - General Statistics PRF |
|---|
| 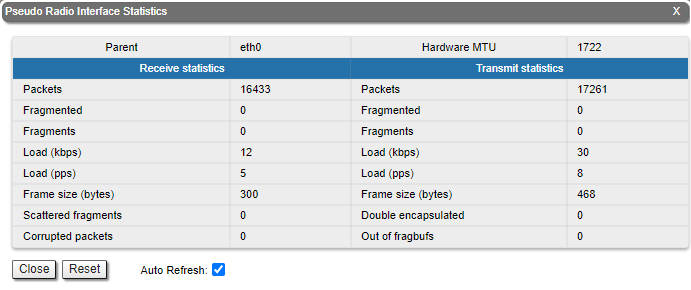 Image Added Image Added
|
|
| Center |
|---|
| Parameter | Description |
|---|
| Receive statistics | | Packets | Number of correctly received packets | | Fragmented | Number of fragmented packets | | Fragments | Number of fragments | | Load (kbps) | The link load, Kbit/s | | Load (pps) | The link load, packets per second | | Frame size (bytes) | The frame size in bytes | | Scattered fragments | Number of frames where one or several fragments were lost, the frame cannot be restored | | Corrupted packets | Number of frames with the wrong length or structure | Transmit statistics | | Packets | Number of correctly transmitted packets | | Fragmented | Number of fragmented packets | | Fragments | Number of fragments | | Load (kbps) | The link load, Kbit/s | | Load (pps) | The link load, packets per second | | Frame size (bytes) | The frame size in bytes | | Double encapsulated packets | Number of frames with double encapsulation | | Out of fragbufs | Number of errors as a result of frame assembly buffer overflow due to too many fragments (neighbors) sources |
|
For the SVI interface information about current status, RX and TX staistics is available.
| Center |
|---|
| Scroll Title |
|---|
| title-alignment | center |
|---|
| title | Figure - General Statistics SVI |
|---|
| Image Added |
|
By clicking the «Close» button, you return to the "Device Status" page.
By clicking the «Reset» button, you clear all counters displayed in the page.
The "Auto Refresh" option is active by default and refreshes the statistics automatically. You can disable the auto refresh.
Modulation Statistics
The "Modulation Statistics" tool displays the information about modulation types, such as receive and transmit statistics for different coding scheme.
Please note that lower modulation is used for service traffic transmission, therefore, if such traffic prevails in the network, the counter growth for low modulations is normal.
| Center |
|---|
| Scroll Title |
|---|
| title | Figure - Modulation Statistics |
|---|
| 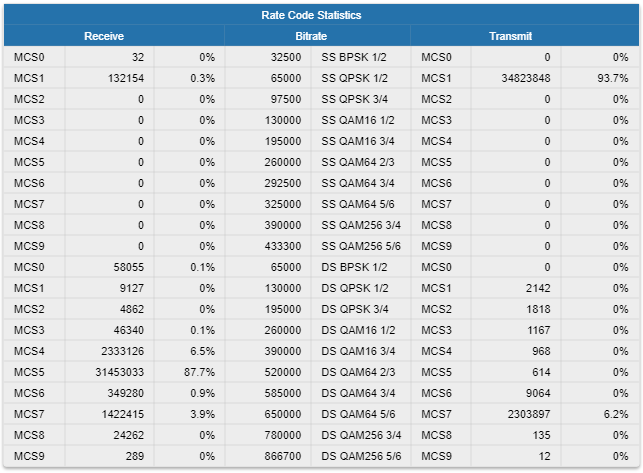 Image Added Image Added
|
|
By clicking the «Close» button, you return to the "Device Status" page.
By clicking the «Reset» button, you clear all counters displayed in the page.
The "Auto Refresh" option is active by default and refreshes the statistics automatically. You can disable the auto refresh.
Errors/Drops Statistics/SNR/EVM
The "Errors/Drops Statistics/SNR/EVM" window displays the number of errors, retries and droped packets during transmission for each link. This tool provides information about the SNR level for each polarization of the remote and local devices, as well as rates of lost and late delivery acknowledgments.
In addition, this section displays the estimated throughput per subscriber in Mbps. The lower values show the guaranteed throughput in the worst case scenario when all subscribers are actively transmitting. The upper values display the throughput in the best scenario, when data is transmitted only by the selected subscriber.
| Center |
|---|
| Scroll Title |
|---|
| title | Figure - Errors/Drops Statistics |
|---|
| 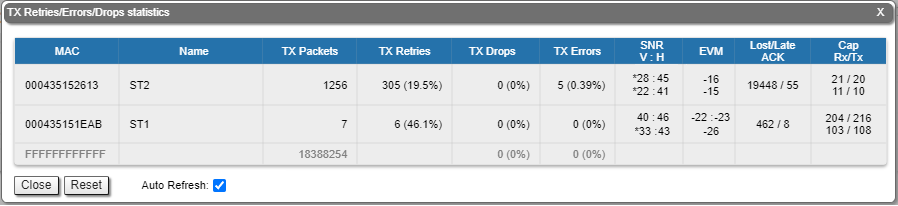 Image Added Image Added
|
|
The EVM value is measured not at the operation modulation, but at the lowest possible. In case the misoctl option is enabled and VBR is disabled on Slave, the lowest possible modulation uses a single data stream. If misoctl is turned off or VBR is turned on, both channels will be used for transmission, and the EVM parameter values will be displayed for each modulation.
By clicking the «Close» button, you return to the "Device Status" page.
By clicking the «Reset» button, you clear all counters displayed in the page.
The "Auto Refresh" option is active by default and refreshes the statistics automatically. You can disable the auto refresh.
Radio Scanner
The "Radio Scanner" tool allows to estimate the efficiency of the radio links utilization, analyzing the radio-frequency environment for the current frequency, under the current channel bandwidth, without the radio link interruption and displays the following statistics:
- Radio parameters of every source in the radio link
- Number of sources, number of packets, including the skipped ones
- Number of pulses, their average level and average number of pulses per second
| Center |
|---|
| Scroll Title |
|---|
| title | Figure - Radio Scanner |
|---|
| 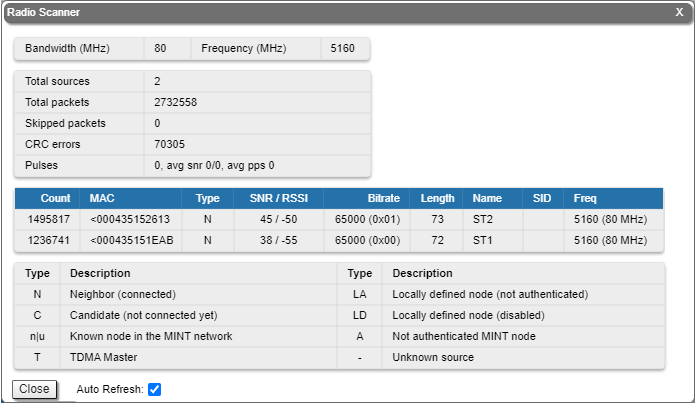 Image Added Image Added
|
|
| Center |
|---|
| Parameter | Description |
|---|
| Count | - Number of the registered frames (packets)
| | MAC | | | Type | | | Level | - First value - signal level relative to the receiver sensitivity at a given modulation (bitrate), in dB
- Second value - absolute input signal level, in dBm
| | Bitrate | | | Length | - Average frame length in bytes
| | Name | | | SID | - Network system identifier
| | Freq | | | Total sources | | | Total packets | - Total number of the registered frames (packets)
| | Skipped packets | - Number of skipped (unaccounted) packets due to queue overflow or lack of CPU resources
| | CRC errors | - Number of errors in the checksum calculation
| | Pulses | - Pulses noise counter:
- The first value is the number of electromagnetic energy peaks during the scanner operation. The Pulses counter includes frames for which the modulation and source MAC address could not be recognized.
- The "avg level" value shows an average noise level, the first value is a noise level relative to the receiver sensitivity at a given modulation (dB), the second is an absolute input signal level (dBm).
- The "avg pps" value indicates an average pulses per second number. The value over 50 pps indicates a high noise level.
|
|
The abbreviations for each node type are also displayed in the interface:
| Center |
|---|
| Scroll Title |
|---|
| | Type | Description |
|---|
| N | | | C | - Candidate (not connected yet)
| | n|u | - n - known node in the MINT network
- u - node in the same MINT domain connected to another sector
| | - | | | LA | - Locally defined node (not authenticated)
| | LD | - Locally defined node (disabled)
| | A | - Not authenticated MINT node
| | T | - Master devices (in software version with TDMA technology support)
|
|
|
| Note |
|---|
|
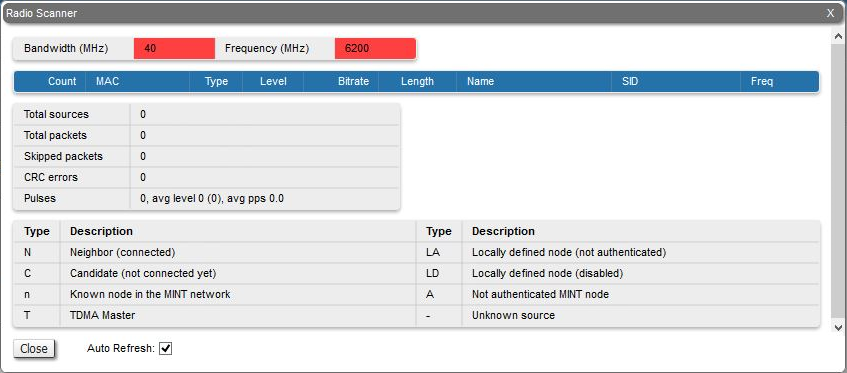 Image Added Image Added
"Frequency" and "Bandwidth" are highlighted in red when the frequency and bandwidth values are already not the same as they were when Radio Scanner was started. This may occur when several profiles at the subscriber terminal link settings are configured. While searching the base station sector the subscriber terminal loops through all available profiles with different settings, highlighting them in red. |
By clicking the «Close» button, you return to the "Device Status" page.By clicking the «Reset» button, you clear all counters displayed in the page.
The "Auto Refresh" option is active by default and refreshes the statistics automatically. You can disable the auto refresh.
...
| Center |
|---|
| Scroll Title |
|---|
| title-alignment | center |
|---|
| title | Figure - Alignment test |
|---|
| 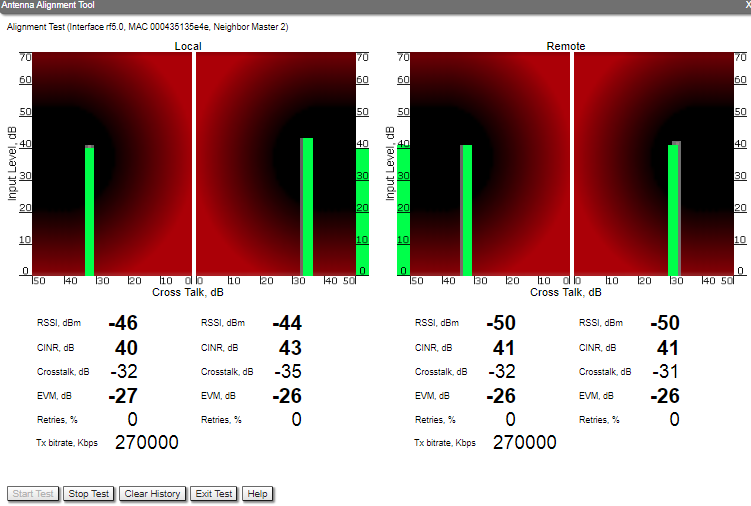 Image Removed Image Removed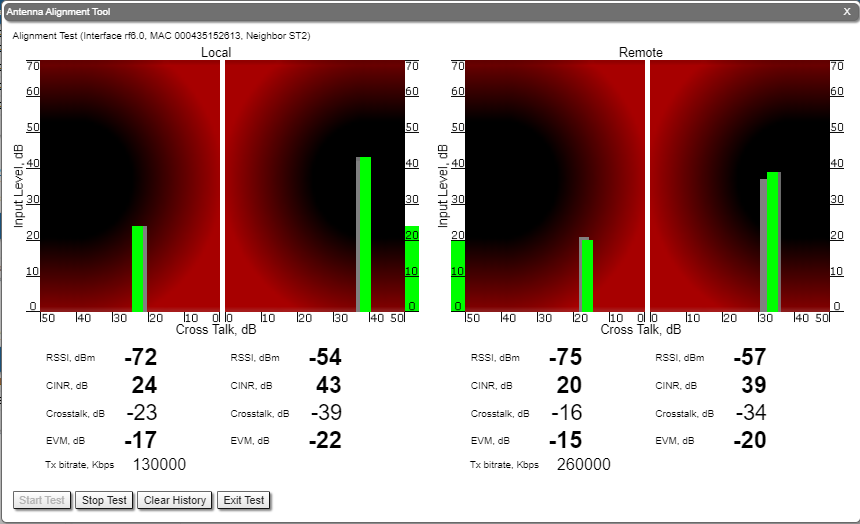 Image Added Image Added
|
|
By clicking the «Start Test»/«Stop Test» buttons at the bottom of the page, you can start/stop the alignment test.
...
- It is recommended to start antenna alignment with searching the maximum signal level on a minimal possible bitrate. Afterwards, automatic MINT mechanisms will set the most appropriate bitrate when “Autobitrate” mode is enabled.
- Input signal level (CINR) should be between 12 dB and 50 dB.
- If signal level is more than 50 dB, it is recommended to lower the amplifier power.
- If maximal signal level is less than 12, it is recommended to lower the channel width (for example: from 20 MHz to 10 MHz).
- In some cases, a signal level that is less than 12 may be enough for the radio link operation. In this case, you should be guided by parameters such as the number of retries and Error Vector Magnitude. If the number of retries is low (close to “0”) and EVM is more than 21 (Input Signal stripe is green) then the radio link is most likely, operating properly.Retries value should be zero or as low as possible (less than 5%).
- The top of an Input Signal stripe should be located in the black area.
- The signal quality should be good: EVM value should be more than 21.
- Input signals of the two antennas of the device should have similar Cross fading values (Input Signal stripes should be symmetrically to the value of 0 dB).
ALL All described recommendations are applicable to both ("Local" and "Remote") sections.
...
Critical events like link outages or frequency swaps are marked by small red balloons on the bottom of each graph. The link down periods are marked with red fields. Move the mouse over each balloon for details:
...