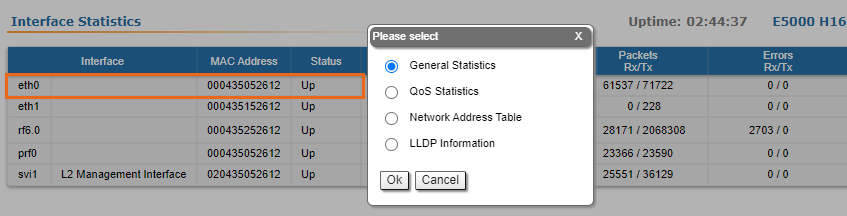
...
| Center | |||||||
|---|---|---|---|---|---|---|---|
|
General Statistics
...
| Center | |||||||
|---|---|---|---|---|---|---|---|
|
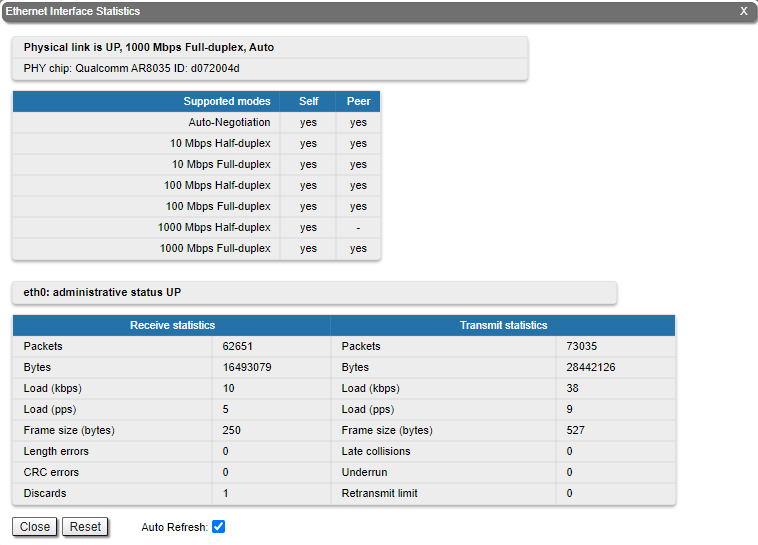
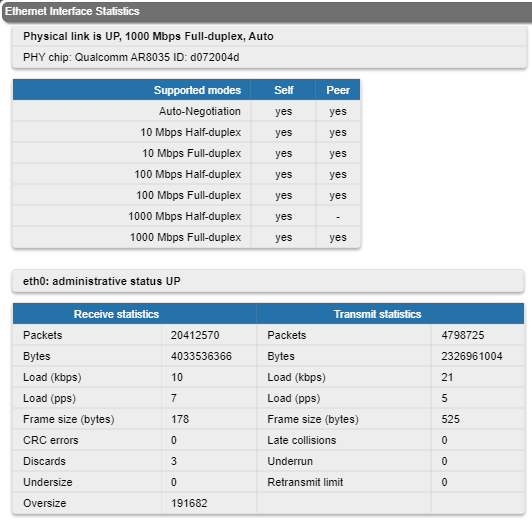
Rx and Tx statistics parameters:
| Center | |||||||||||||||||||||||||||||||||||||||||||
|---|---|---|---|---|---|---|---|---|---|---|---|---|---|---|---|---|---|---|---|---|---|---|---|---|---|---|---|---|---|---|---|---|---|---|---|---|---|---|---|---|---|---|---|
| |||||||||||||||||||||||||||||||||||||||||||
For the pseudo- radio interface information about parent interface, MTU value current status, DFS mode and load statistics is available.
| Center | |||||||
|---|---|---|---|---|---|---|---|
|
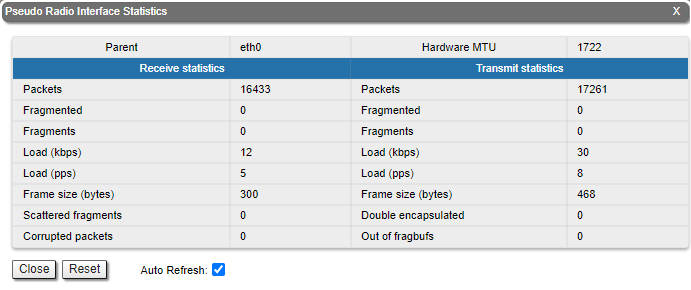
Rx and Tx statistics parameters:
| Center | ||||||||||||||||||||||||||||||||||||||||||
|---|---|---|---|---|---|---|---|---|---|---|---|---|---|---|---|---|---|---|---|---|---|---|---|---|---|---|---|---|---|---|---|---|---|---|---|---|---|---|---|---|---|---|
Fragments | Number of fragments
Scattered fragments | Number of frames where one or several fragments were lost, the frame cannot be restored | Corrupted packets | Number of frames with the wrong length or structure | Transmit statistics Packets | Number of correctly transmitted packets | Fragmented | Number of fragmented packets | Fragments | Number of fragments | Load (kbps) | The link load, Kbit/s | Load (pps) | The link load, packets per second | Frame size (bytes) | The frame size in bytes | Double encapsulated packets | Number of frames with double encapsulation Out of fragbufs | Number of errors as a result of frame assembly buffer overflow due to too many fragments (neighbors) sources | | ||||||||||||||||||||||
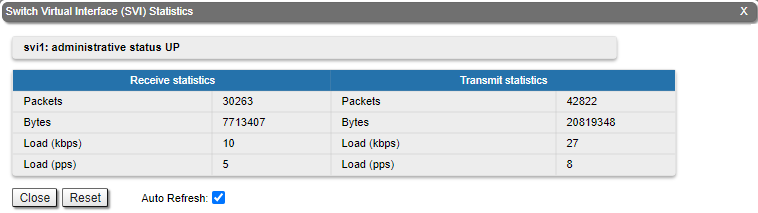
For the SVI interface information about current status, RX and TX staistics is available.
| Center | |||||||
|---|---|---|---|---|---|---|---|
|
| ||||||||||||||||||||||||||||||||||||||||||||||||||||||||||||
For the pseudo-radio interface information about parent interface, MTU value and load statistics is available.
| Center | |||||
|---|---|---|---|---|---|
|
| Center | ||||||||||||||||||||||||||||||||||||||
|---|---|---|---|---|---|---|---|---|---|---|---|---|---|---|---|---|---|---|---|---|---|---|---|---|---|---|---|---|---|---|---|---|---|---|---|---|---|---|
| ||||||||||||||||||||||||||||||||||||||
For the SVI interface information about current status, RX and TX staistics is available.
| Center | |||||||
|---|---|---|---|---|---|---|---|
|
By clicking the «Close» button, you return to the "Device Status" page.
By clicking the «Reset» button, you clear all counters displayed in the page.
The "Auto Refresh" option is active by default and refreshes the statistics automatically. You can disable the auto refresh.
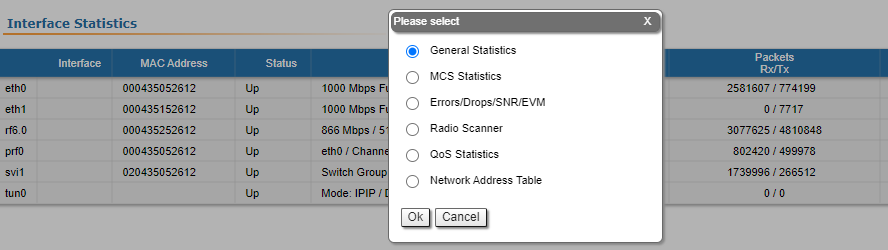
Modulation Statistics
The "Modulation Statistics" tool displays the information about modulation types, such as receive and transmit statistics for different coding scheme.
Please note that lower modulation is used for service traffic transmission, therefore, if such traffic prevails in the network, the counter growth for low modulations is normal.
| Center | |||||
|---|---|---|---|---|---|
|
By clicking the «Close» button, you return to the "Device Status" page.
By clicking the «Reset» button, you clear all counters displayed in the page.
The "Auto Refresh" option is active by default and refreshes the statistics automatically. You can disable the auto refresh.
Errors/Drops Statistics/SNR/EVM
The "Errors/Drops Statistics/SNR/EVM" window displays the number of errors, retries and droped packets during transmission for each link. This tool provides information about the SNR level for each polarization of the remote and local devices, as well as rates of lost and late delivery acknowledgments.
In addition, this section displays the estimated throughput per subscriber in Mbps. The lower values show the guaranteed throughput in the worst case scenario when all subscribers are actively transmitting. The upper values display the throughput in the best scenario, when data is transmitted only by the selected subscriber.
| Center | |||||
|---|---|---|---|---|---|
|
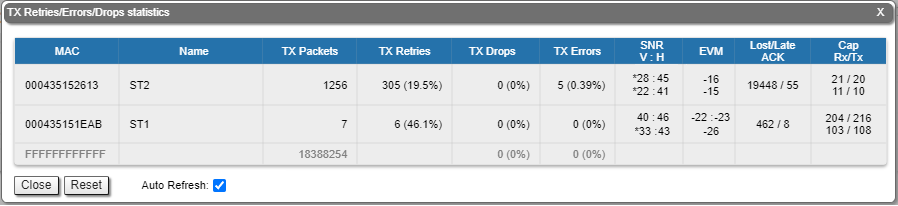
The EVM value is measured not at the operation modulation, but at the lowest possible. In case the misoctl option is enabled and VBR is disabled on Slave, the lowest possible modulation uses a single data stream. If misoctl is turned off or VBR is turned on, both channels will be used for transmission, and the EVM parameter values will be displayed for each modulation.
By clicking the «Close» button, you return to the "Device Status" page.
By clicking the «Reset» button, you clear all counters displayed in the page.
The "Auto Refresh" option is active by default and refreshes the statistics automatically. You can disable the auto refresh.
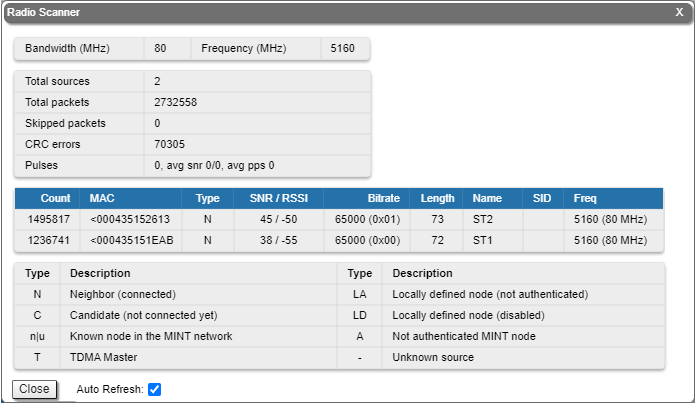
Radio Scanner
The "Radio Scanner" tool allows to estimate the efficiency of the radio links utilization, analyzing the radio-frequency environment for the current frequency, under the current channel bandwidth, without the radio link interruption and displays the following statistics:
- Radio parameters of every source in the radio link
- Number of sources, number of packets, including the skipped ones
- Number of pulses, their average level and average number of pulses per second
| Center | |||||
|---|---|---|---|---|---|
|
| Center | ||||||||||||||||||||||||||||||
|---|---|---|---|---|---|---|---|---|---|---|---|---|---|---|---|---|---|---|---|---|---|---|---|---|---|---|---|---|---|---|
|
The abbreviations for each node type are also displayed in the interface:
| Center | |||||||||||||||||||||||
|---|---|---|---|---|---|---|---|---|---|---|---|---|---|---|---|---|---|---|---|---|---|---|---|
|
| Note | ||
|---|---|---|
| ||
"Frequency" and "Bandwidth" are highlighted in red when the frequency and bandwidth values are already not the same as they were when Radio Scanner was started. This may occur when several profiles at the subscriber terminal link settings are configured. While searching the base station sector the subscriber terminal loops through all available profiles with different settings, highlighting them in red. |
By clicking the «Close» button, you return to the "Device Status" page.By clicking the «Reset» button, you clear all counters displayed in the page.
The "Auto Refresh" option is active by default and refreshes the statistics automatically. You can disable the auto refresh.
...
| Center | |||||||
|---|---|---|---|---|---|---|---|
|
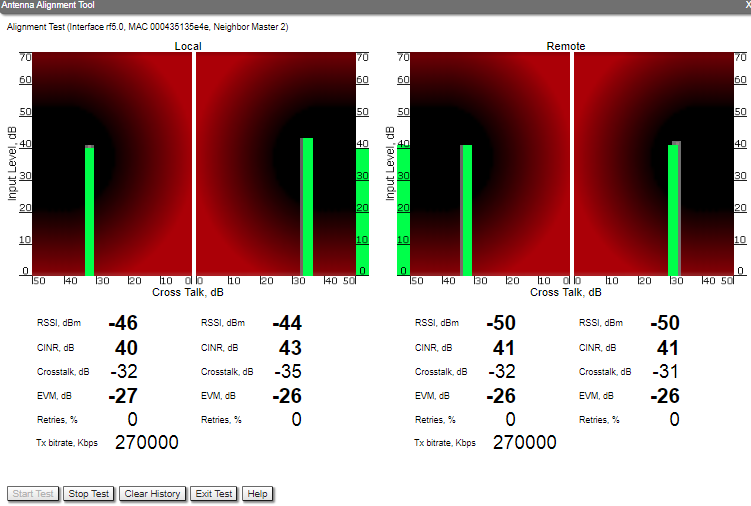
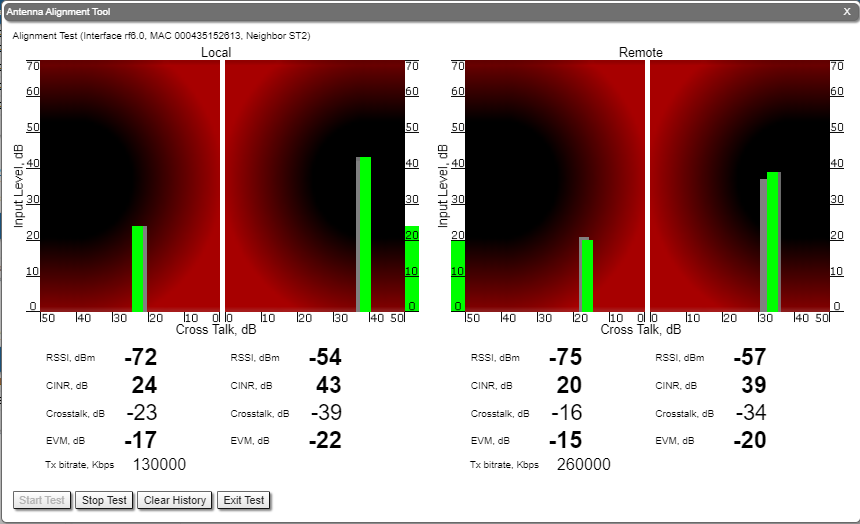
By clicking the «Start Test»/«Stop Test» buttons at the bottom of the page, you can start/stop the alignment test.
...
- It is recommended to start antenna alignment with searching the maximum signal level on a minimal possible bitrate. Afterwards, automatic MINT mechanisms will set the most appropriate bitrate when “Autobitrate” mode is enabled.
- Input signal level (CINR) should be between 12 dB and 50 dB.
- If signal level is more than 50 dB, it is recommended to lower the amplifier power.
- If maximal signal level is less than 12, it is recommended to lower the channel width (for example: from 20 MHz to 10 MHz).
- In some cases, a signal level that is less than 12 may be enough for the radio link operation. In this case, you should be guided by parameters such as the number of retries and Error Vector Magnitude. If the number of retries is low (close to “0”) and EVM is more than 21 (Input Signal stripe is green) then the radio link is most likely, operating properly.
- Retries value should be zero or as low as possible (less than 5%).
- The top of an Input Signal stripe should be located in the black area.
- The signal quality should be good: EVM value should be more than 21.
- Input signals of the two antennas of the device should have similar Cross fading values (Input Signal stripes should be symmetrically to the value of 0 dB).
ALL All described recommendations are applicable to both ("Local" and "Remote") sections.
...
Critical events like link outages or frequency swaps are marked by small red balloons on the bottom of each graph. The link down periods are marked with red fields. Move the mouse over each balloon for details:
...