...
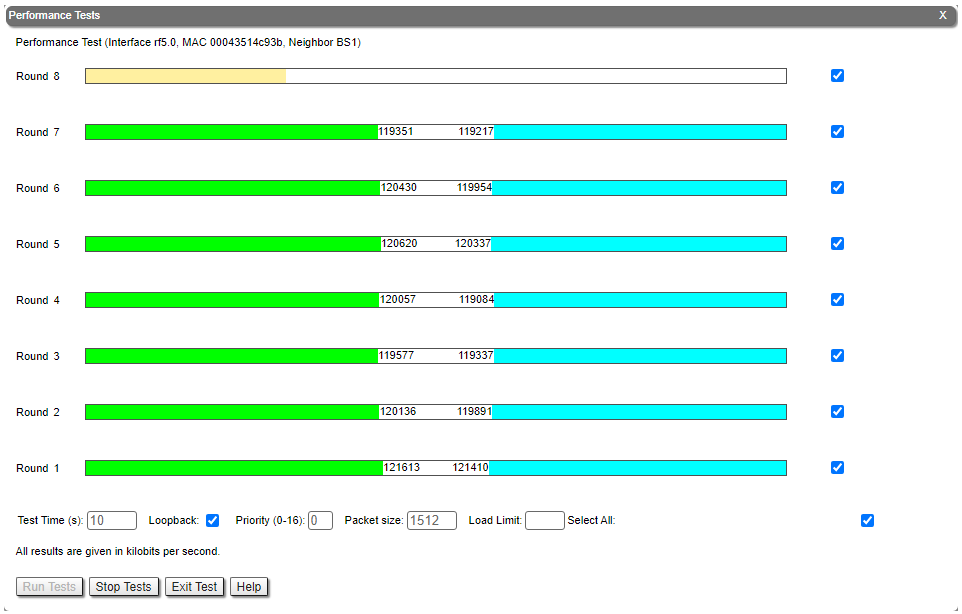
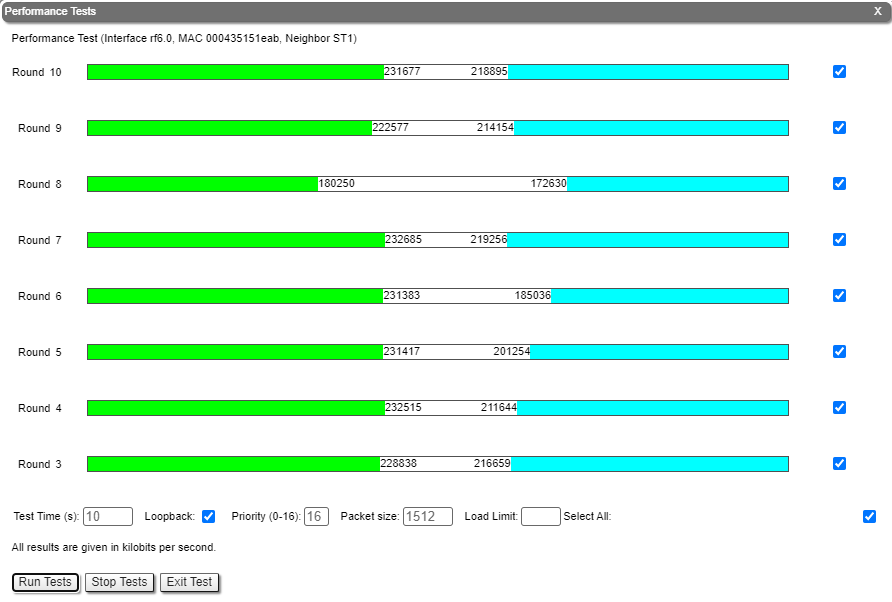
The throughput test can be performed with the "Performance Tests" tool built into the web interface, in the section "Device status" → "Link statistics for the rf5rf6.0 interface". This tool generates test traffic between the devices and it allows to obtain data about the real link throughput both in one direction and in a two-way manner. The throughput evaluation is performed using traffic with the specified priority without taking into account the service traffic required to maintain the link operational. To exclude the influence of the data traffic on the test's result, it is recommended to set the highest priority for the test traffic (at least 15). Performance tests are always performed on the highest modulation,the detailed description of the parameters and the performance test settings are available in the "Device Status menu" article.
| Center | |||||||
|---|---|---|---|---|---|---|---|
|
Command line interface
When using the command line interface to manage the device, it is possible to test the radio link via the "ltest" command.
Wireless link status
Link statistics on the
...
rf6.0 interface
Web interface
To evaluate the quality of the wireless connection with the neighboring device, use the color indication in the "Status" column of the "Link statistics on rf5.0" subsection:
...
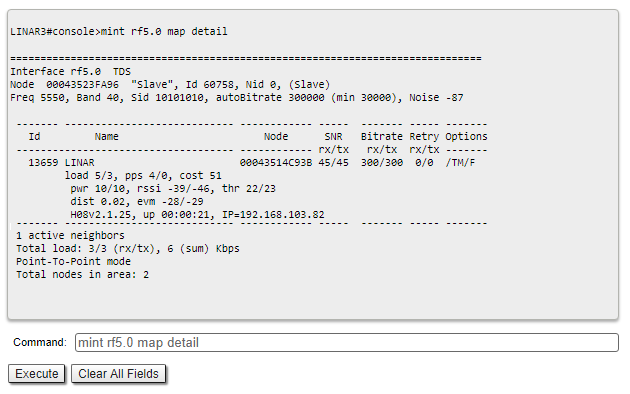
Make sure that the "TX Power" and "Bitrate" parameters match with the values of the planning phase. In the "Link statistics on rf5rf6.0" of the "Device status" section, pay attention to the wireless connection parameters. The main parameters are the retries number and the bitrate. It is not recommended to use the link with a retries number exceeding 5%. The actual bitrate (modulation level) depends on the SNR parameter - the signal-to-noise ratio. The highest modulations are available at SNR values of 27-50 dB.
...
To display information about the wireless link status via the command line interface, use the "mint rf5rf6.0 map detail" command.
| Center | |||||||
|---|---|---|---|---|---|---|---|
|
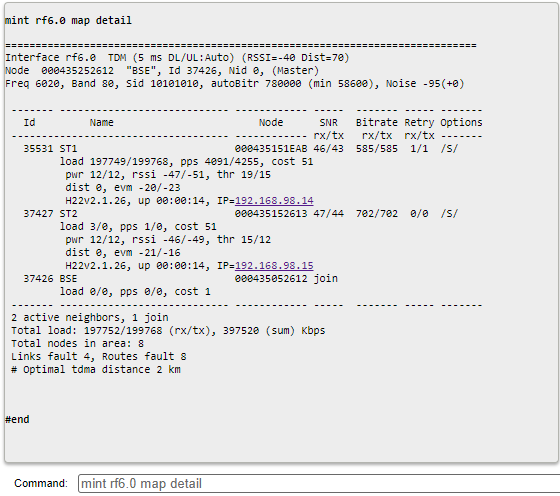
Pay attention to the indicators in the "Options" column. The following values are possible:
...
- At the "pwr" column - hardware device failure.
- At the "rssi" column - significant difference between the signal power of the vertical and horizontal polarizations.
Radio statistics
Web interface
In case of a high retries level, use the built-in statistics tools. The "General statistics" section contains information about the link load, queue overflow, etc.Command line interface
To display statistics via the command line interface, use the ""rfconfig stat" command.
| Center | |||||||
|---|---|---|---|---|---|---|---|
|
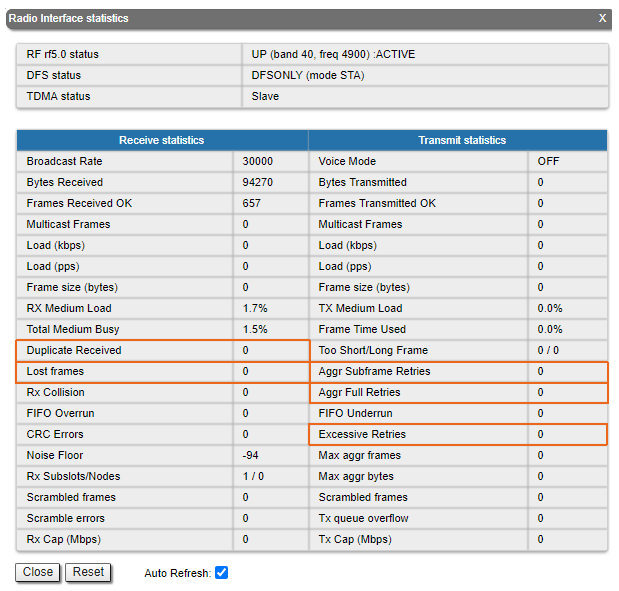
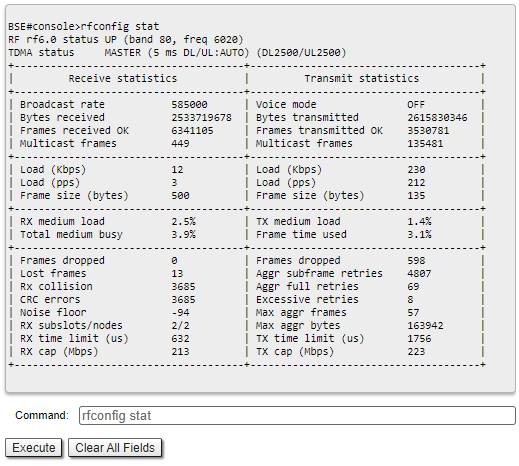
Pay attention to the following indicators:
- "Lost Frames" - the number of frames that were not received by the device, even after retrying.
- "Duplicates Received" - the number of frames that were received several times because the other side did not receive an acknowledgment of the frame."Aggr Subframe Retries" and "Aggr Full Retries" - the number of frames that the device has sent several times because the other side did not acknowledge the receipt.
- "Excessive Retries" - the number of frames that failed to to be sent after all the retry attempts.
Command line interface
To display statistics via the command line interface, use the ""rfconfig stat" command.
QoS statistics
Web interface
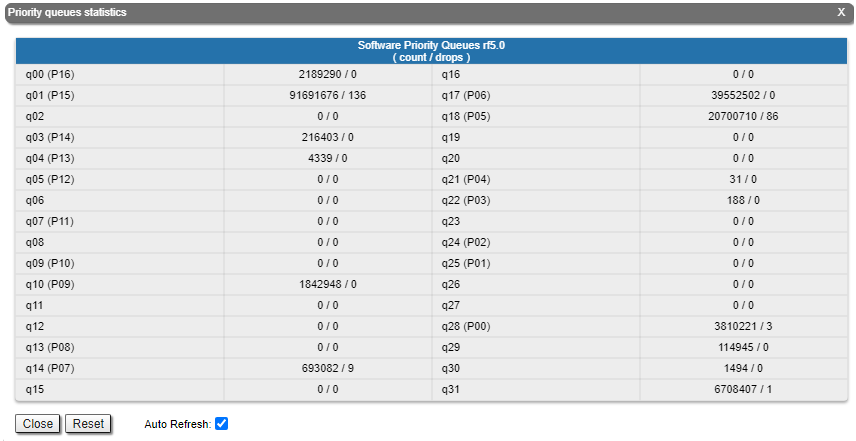
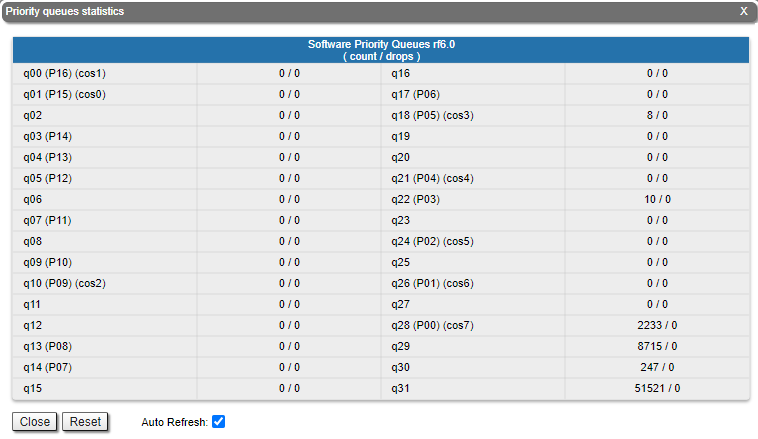
The "QoS statistics" section provides information about the transmitted and dropped packets in each priority queue configured on the device. Drops present in the traffic processing queues indicate that the throughput threshold has been exceeded. Losses in queue q00 (P16) are acceptable because this queue contains performance test data.
| Center | |||||||
|---|---|---|---|---|---|---|---|
|
Command line interface
To display statistic via the command line interface, use the "rfconfig rf5rf6.0 stat qos" command. The number of dropped packets for each configured queue can be displayed by the "qm stat" command.
...
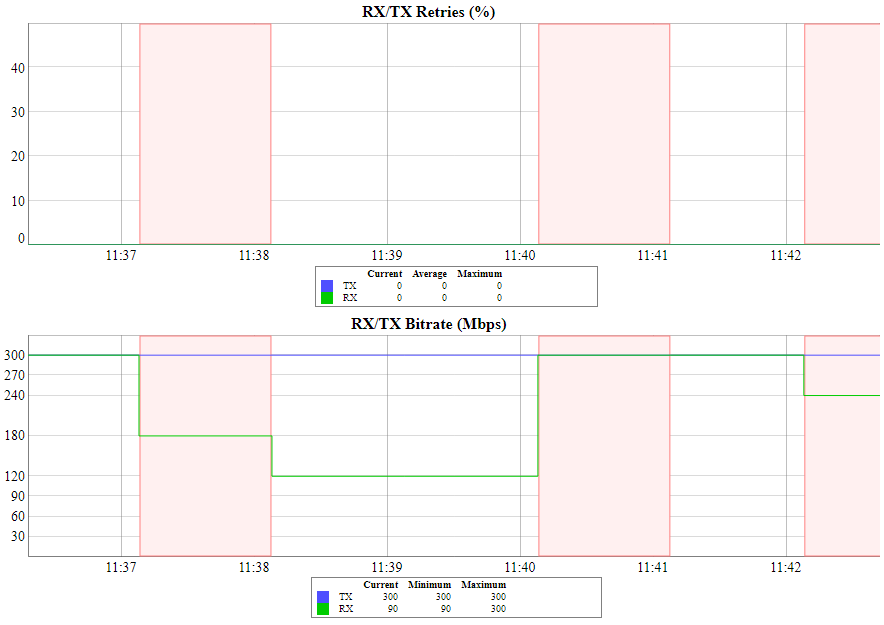
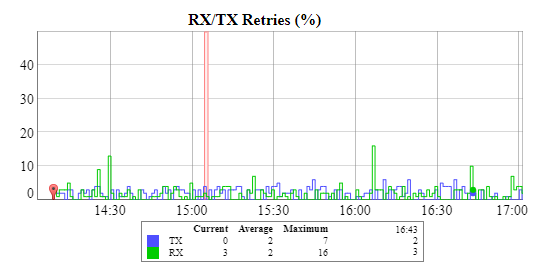
If the link has deteriorated during its operation, having the initial parameters corresponding to the calculated ones, it is necessary to find out when the problem has occured. Use the "Statistics graphs" tool to determine when or how often the problem occurs by changing the display options.
| Center | |||||||
|---|---|---|---|---|---|---|---|
|
Device status
Pay attention to the CPU and memory usage indicators in the "Device status" section. Excessive processes running on a device can overflow the volatile memory and overload the CPU (over 95% usage), leading to a deterioration in the wireless link's quality. The CPU load can be displayed using the "system cpu" command and information about the device's memory state can be shown using the "mem" command.
| Center | |||||||
|---|---|---|---|---|---|---|---|
|

...
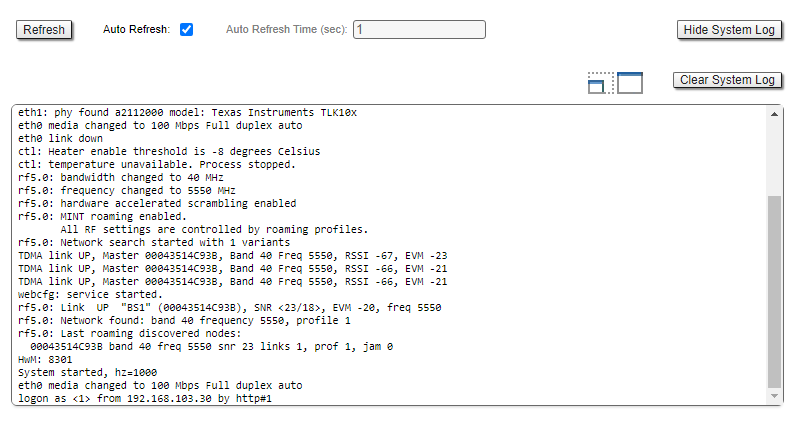
Proceed to the System Log tool in the "Device status" section or by using the "system log" command. Using the log entries, check if the link degradation was caused by a configuration change ("system reconfiguration" message). Restore the previous version of the configuration if necessary. Detailed information about saving and uploading the configuration is available in the "General Purpose Command Set" article.
| Center | |||||||
|---|---|---|---|---|---|---|---|
|
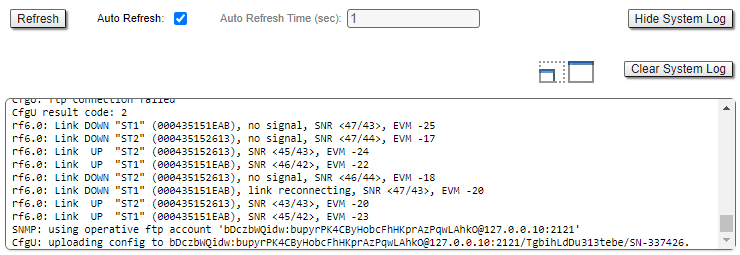
Pay attention to the following messages:
...
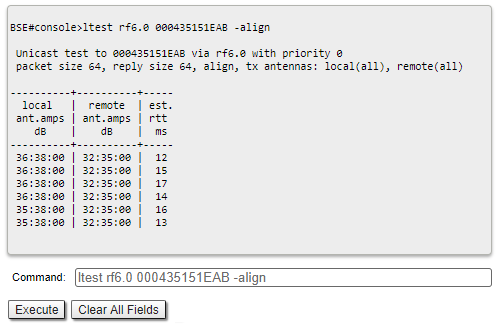
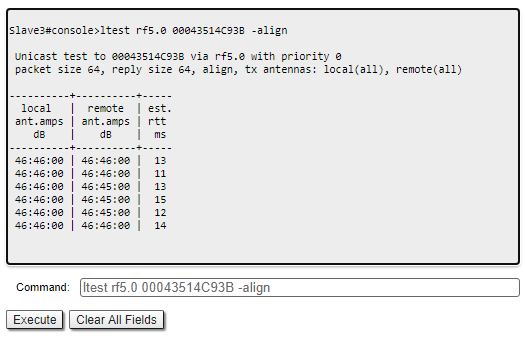
When using the command line to manage the device, fine antenna alignment can be performed using the "ltest rf5rf6.0 MAC ADDRESS -align" command. The command output will show the average CINR for the local and the remote devices.
| Center | |||||
|---|---|---|---|---|---|
| Note | |||||
| |||||
The "muffer rf5.0 scan" command can take a long time to execute and disrupt the normal operation of the radio module.
|
Analysis of the radio environment
Web interface
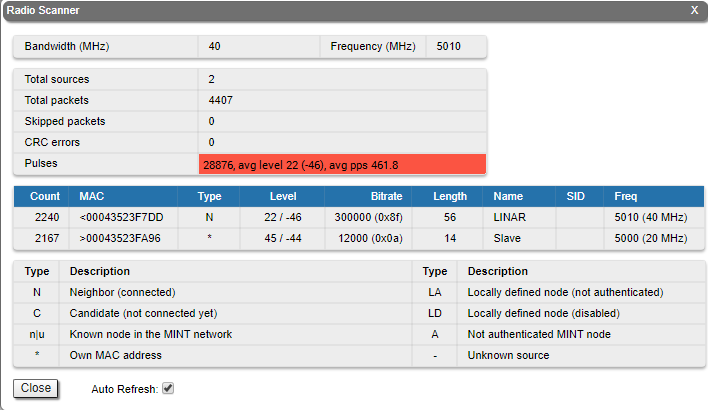
To assess the state of the radio environment proceed to the "Radio Scanner" tool. The tool has the following purposes:
- allows to evaluate the radio sources on the current central frequency and, if necessary, perform frequency diversity in order to reduce their mutual influence;
- displays information about the impulse noise. A number of pulses per second over 50 indicates significant interference on the selected frequency.
Use the "Spectrum Analyzer" tool to select a frequency free from interference or use the automatic frequency selection mechanisms. For more information about the dynamic frequency selection algorithms proceed to the "Dynamic Frequency Selection" article.
| Center | |||||
|---|---|---|---|---|---|
|
Command line interface
Detailed information about the state of the radio environment is available via the "muffer" command. The "muffer rf5.0 scan" command allows to check the radio environment for the presence of radio signal sources on all the available frequencies.
|