Successfully pass the free certification exam at IW Academy and become an Infinet Certified Engineer.
The Graphs tool allows to trace the device parameters represented in the diagrams. Available modes: realtime tracking, displaying data for hour, day, week or month. Choose mode in the drop-down list located in the lower right corner of the "Graphs" section. By default, the system displays the daily data log.
Scaling can be performed for all active diagrams using the timeline at the bottom of the page.
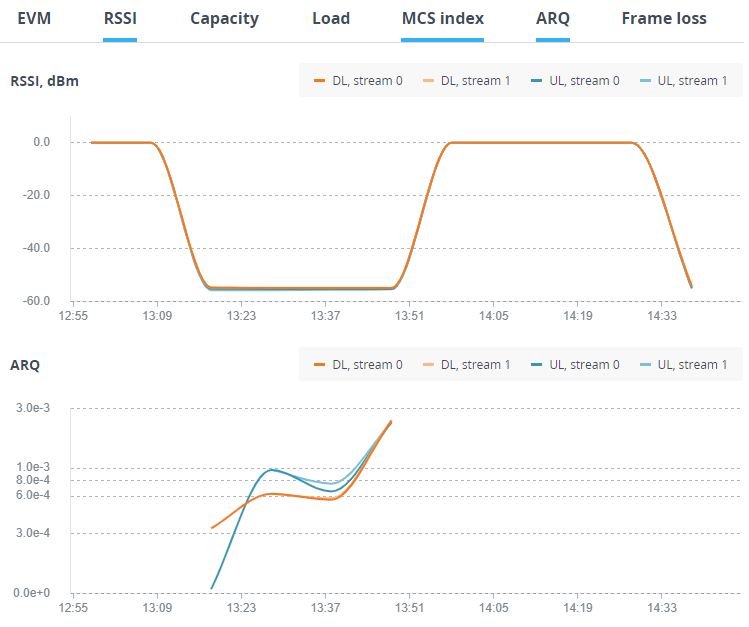
To display a diagram of the certain device parameter values, activate this parameter at the top of the page. There are two display modes available: a list, where all graphs are arranged sequentially one below the other, and tiles with two graphs in a row.
| Pararmetr | Description |
|---|---|
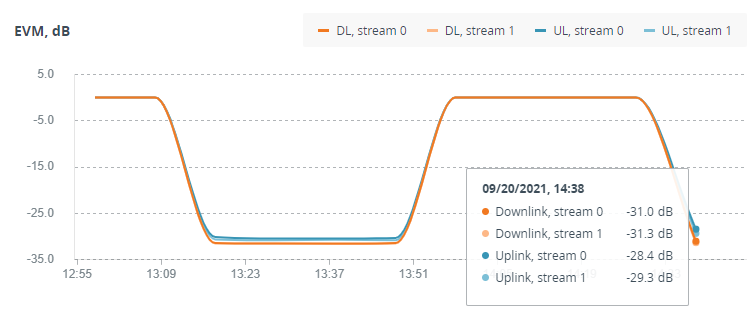
| EVM | Error vector magnitude - indicator of the measured input signal quality, telling how far are the received constellation symbols compared to the ideal symbols of the constellation. The parameter value must be as high as possible in absolute value. The recommended level should be less than -21 dB. |
| RSSI | The RSSI indicator displays the received signal level for each channel (uplink and downlink). Available values:
|
| Capacity | Available throughput of the wireless link, in Mbps. |
| Load | Used throughput of the wireless link, in Mbps. |
| MCS index | Modulation and coding scheme selected for transmission. |
| ARQ | An indicator of the resent packets number. |
| Frame loss | An indicator of the packets lost during transmission. |
To display the precise parameter values at a certain point of time, hover the cursor over the graph at this place.