The "Device Status" page is displayed by default after the authentication step. It displays the main parameters of the unit in real-time. You can set the "Auto Refresh" option to refresh the statistics automatically. Refresh frequency can be set by the "Auto Refresh Time" parameter. The minimal possible value is “0” seconds and it updates the information instantly.
The device statistics can also be refreshed manually by clicking the «Refresh» button.
These options are available in the bottom-left side of the "Device Status" screen:
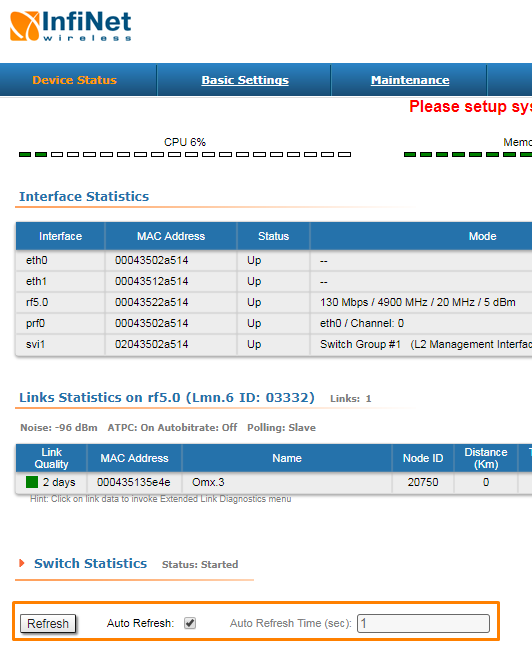
The "Device Status" page has the following sections:
- "CPU load" - displays the load percentage of the CPU
- "Memory load":
- Memory (the data stored in volatile memory are valid only during the current session, until the system reset) displays in real-time the total memory available and the used memory by the running processes
- Flash memory (non-volatile memory) displays in real-time the total memory available and the used memory by the WANFleX and configuration files
- "Interface Statistics" - displays the main parameters of all configured interfaces (physical and logical)
- "Wireless Links Statistics" - displays the main parameters of all wireless connections between the device and the neighbor devices
- "Switch Statistics" - displays counters of the frames which have been switched (for example: the number of dropped packets and if they are dropped because of the flood into their reachable destination, because of the STP, because of the firewall, etc).
Interface Statistics
| Parameter | Description |
|---|---|
Interface |
|
| MAC Address |
|
| Status |
|
| Mode |
|
| Packets |
|
| Errors |
|
| Load |
|
All these counters can be reset by clicking the «Reset All Counters» button:
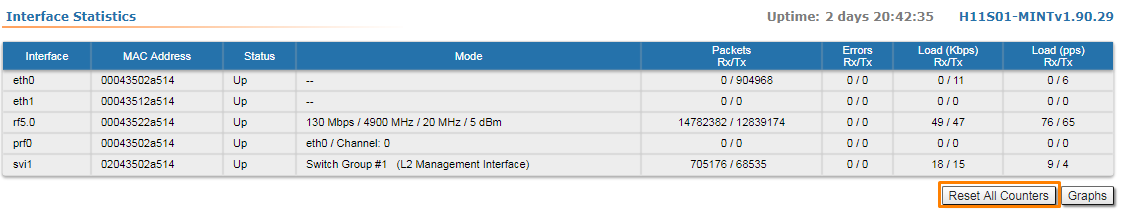
CAUTION
Clearing these counters by clicking the «OK» button in the pop-up page means losing the history data about the functionality of your unit. Avoid this operation unless you are completely sure you don’t need these data in the future.
The software version is displayed in the right side of Interface Statistics section (for example: MINTv1.90.5).
Links Statistics on rf5.0
This section displays the following information for the radio interface of the unit:
- Node name and ID
- Noise level
- Number of established links
- ATPC status (activated or deactivated)
- Autobitrate status (activated or deactivated)
- Polling mode
| Parameter | Description |
|---|---|
| Status |
|
| MAC Address |
|
| Name |
|
| Node ID |
|
| Distance |
|
| Tx Power |
|
| SNR |
|
| Current Level |
|
| Bitrate |
|
| Retries |
|
| Errors |
|
| Load |
|
By clicking the "Route Map" button you can get the MINT topology schematic map with the visualization of the active and alternative routes to each node.
NOTE
Map is available for H08, H09, H11 hardware platforms.
Schematic topology map allows you to visually determine the network connectivity and complexity and to track the route switching, including mobile objects.
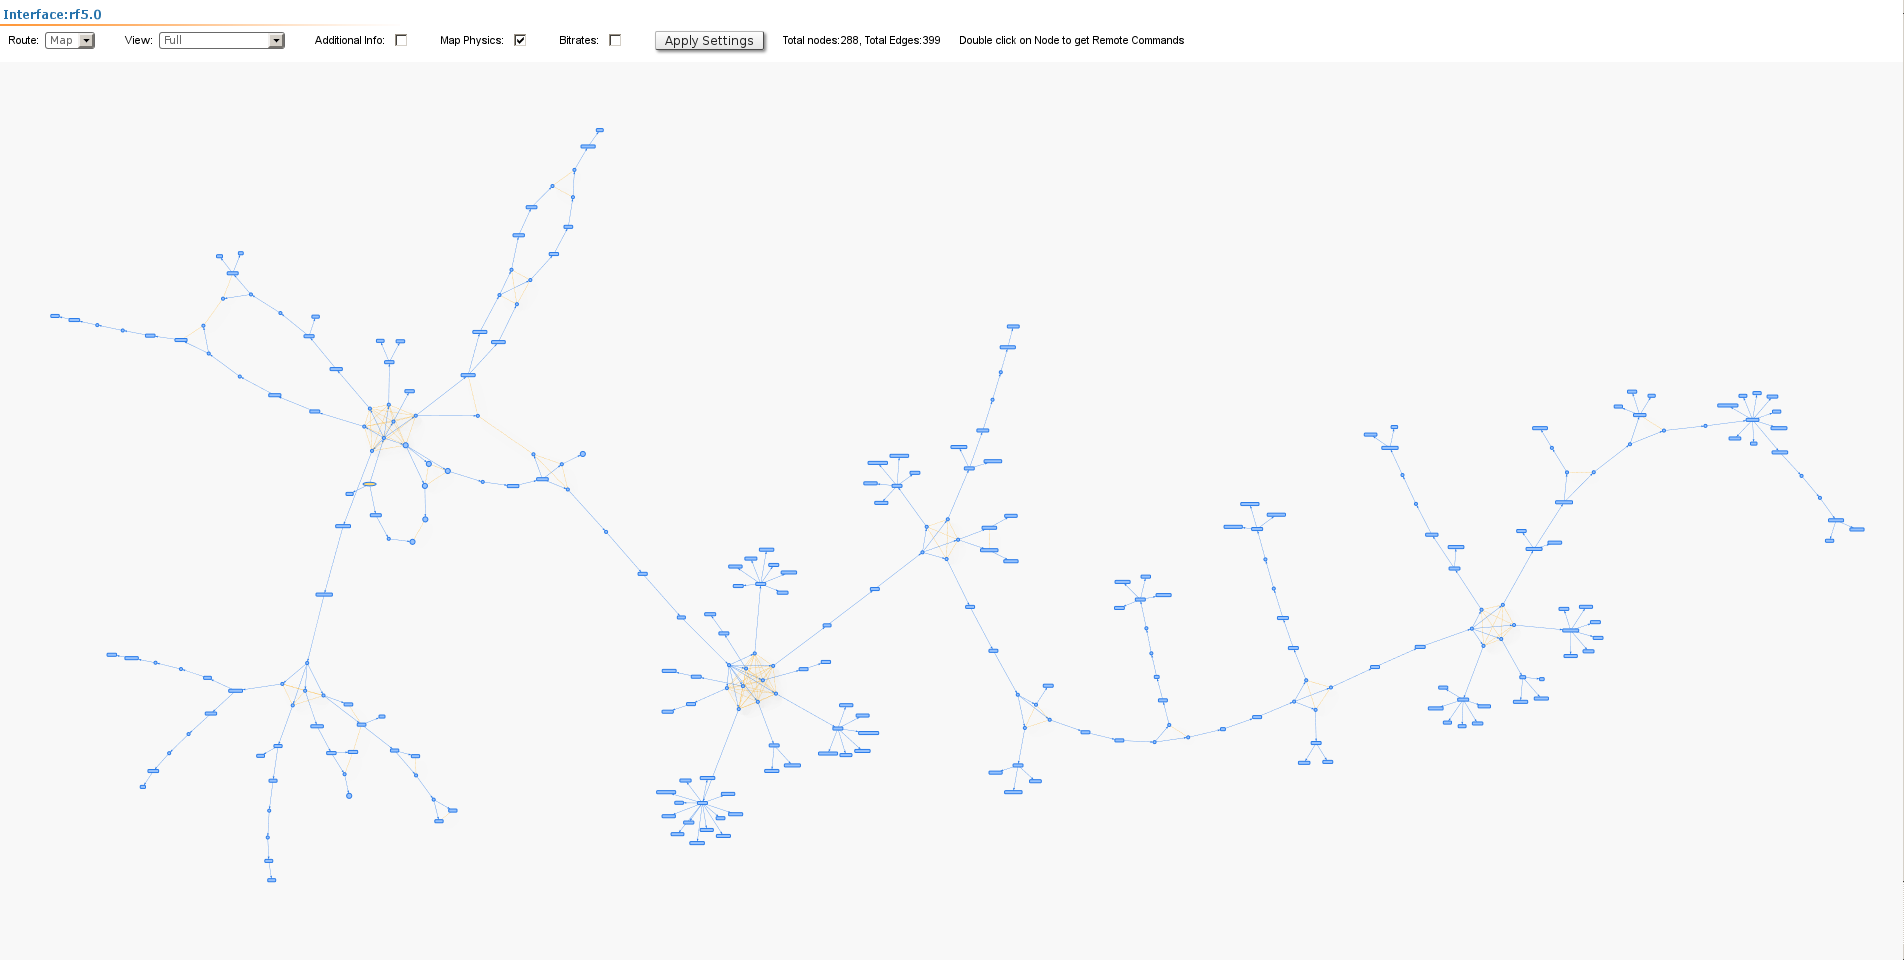
For additional information on each node, double click on it to get remote commands (rcmd).
Detailed information about options in this tool is described in the "Remote Commands" section.
In TDMA based software in the "Wireless Links Statistics for Interface rf5.0" section some additional information is available:
- about wireless link parameters;
- deflection angle from the main antenna direction towards the subscriber terminal, in the column "Distance" (only for R5000-Qmxb sector base station with beamforming technology).

| Parameter | Description |
|---|---|
| Current TDMA parameters |
|
| RSSI (dBm) Rx/Tx |
|
Sync Status |
|
| Sat: |
|
Switch Statistics
This section displays the number of unicast, broadcast and flood packets switched within each Switch group and also within kernel system (internal traffic), in real-time (since the last reboot):
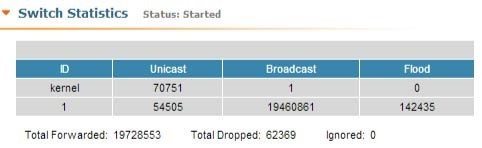
It also displays the number of dropped packets for: STP, unreachable destination, firewall, possible loop, discard, MAC limits and reverse, within each Switch group and kernel, in real-time (since the last reboot):

Total forwarded, dropped and ignored packets are displayed in real-time, too.
All these counters can be reset by clicking the «Reset All Counters» button.
Switch Statistics parameters:
| Parameter | Description |
|---|---|
| Unicast |
|
| Broadcast |
|
| Flood |
|
| STP |
|
| Unreachable |
|
Firewall |
|
| Possible loop |
|
| Discard |
|
| MAC Limit |
|
| Reverse |
|
By clicking the «Show System Log» button, you can view the "System Log" section:
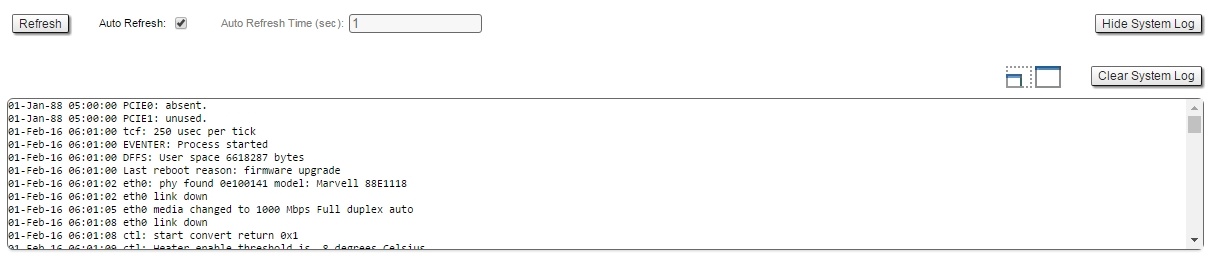
The "System Log" section allows browsing the unit’s system log. It is possible to minimize/enlarge the system log window by clicking the buttons: 
You can delete all the information saved in the system log by clicking the «Clear System Log» button. You can hide the System Log section by clicking the «Hide System Log» button.
Extended Interface Statistics
The "Extended Interface Statistics" tools gather complete information and enhanced statistics for each interface of the unit. Each interface type has its own set of available tools applicable to it.
In order to access the "Extended Interface Statistics" tools, click on the row of each interface within the "Interface Statistics" section:
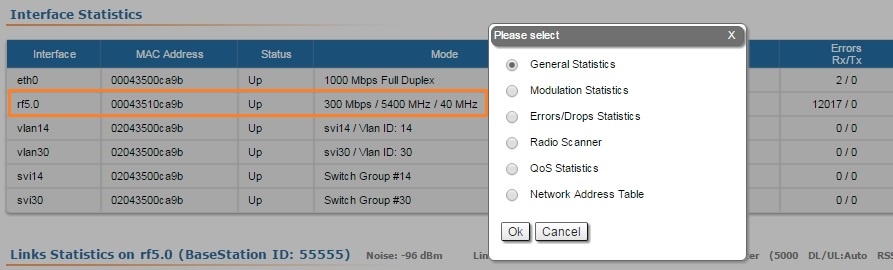
General Statistics
The "General Statistics" tool displays the information about the interface such as the interface mode, current status, Rx and Tx statistics, etc. The actual statistics details depend on the interface type.
For Ethernet interfaces information about current status, operational mode and load statistics is available.
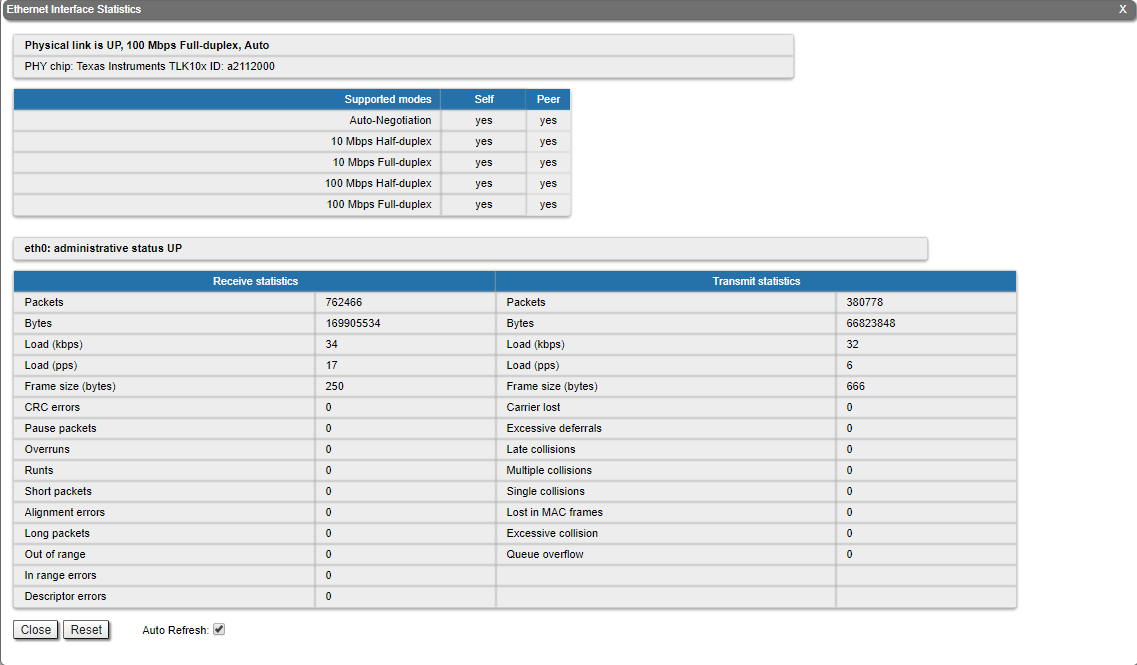
Rx and Tx statistics parameters:
| Parameter | Description |
|---|---|
| Receive statistics | |
| Packets | The total number of received packets |
| Bytes | The sum of lengths of all good Ethernet frames received |
| Load (kbps) | The link load, Kbit/s |
| Load (pps) | The link load, packets per second |
| Frame size (bytes) | The frame size in bytes |
CRC errors | Total frames received with a CRC error |
Pause packets | The number of good frames received that have a Pause destination MAC address |
| Overruns | Packets dropped due to queue overflow |
Runts | Total frames received with a length of less than 64 octets and an invalid FCS |
Short packets | Total frames received with a length of less than 64 octets but with a valid FCS |
| Alignment errors | Number of frames received with bad number of octets and bad CRC |
Long packets | Total frames received with a length of more than MaxSize octets but with a valid FCS |
Transmit statistics | |
Packets | The total number of transmitted packets |
Bytes | The sum of lengths of all good Ethernet frames sent |
| Load (kbps) | The link load, Kbit/s |
| Load (pps) | The link load, packets per second |
| Frame size (bytes) | The frame size in bytes |
Excessive deferrals | The total number frames that are delayed because the medium was busy |
Late collisions | The number of times a collision is detected later than 512 bits-times into the transmission of a frame |
Multiple collisions | The total number of successfully transmitted frames that experienced more than one collision |
Single collisions | The total number of successfully transmitted frames that experienced exactly one collision |
Excessive collisions | The total number of frames dropped after 16 attempts to send ended with collision |
| Queue overflow | Packets dropped due to queue overflow |
For the radio interface information about current status, DFS mode and load statistics is available.
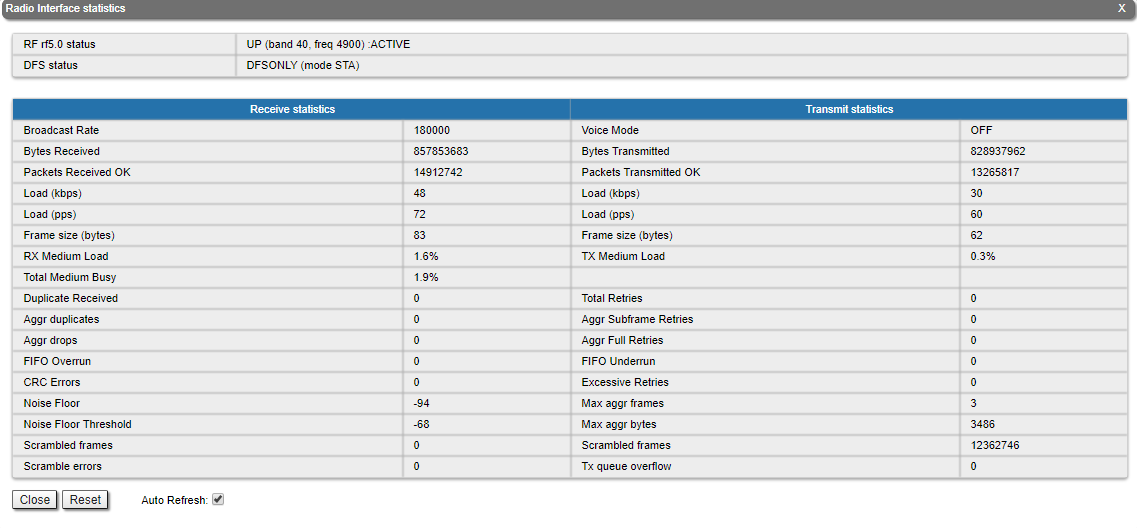
Rx and Tx statistics parameters:
| Параметр | Описание |
|---|---|
| Receive statistics | |
| Broadcast Rate | Current Bitrate for broadcast and multicast packets on the BS depends on the speed of the slowest subscriber |
| Bytes Received | Number of received bytes including headers |
| Packets Received OK | Number of correctly received packets |
| Load (kbps) | The link load, Kbit/s |
| Load (pps) | The link load, packets per second |
| Frame size (bytes) | The frame size in bytes |
| RX Medium Load | Time spent on receiving frames (%) |
| Total Medium Busy | The total time medium was busy (both DL and UL) (%) |
| Duplicate Received | The number of duplicate packets received |
| FIFO Overrun | Number of FIFO queues overruns in the radio when receiving |
| CRC Errors | Total frames received with a CRC error |
| Noise Floor | Input noise level. Measurement cycle –10 seconds |
| Noise Floor Threshold | Noise floor threshold for carrier detect |
| Scrambled frames | The total number of scrambled frames received |
| Scramble errors | The number of descrambling errors |
| Rx Cap (Mbps) | Throughput limit for UL (Mbps) - only in TDMA version |
Transmit statistics | |
Voice Mode | Voice mode ON/OFF value. If turned ON, the mode of voice traffic prioritized processing is turned on |
| Bytes Transmitted | Number of transmitted bytes including headers |
| Packets Transmitted OK | Number of correctly transmitted packets |
| Load (kbps) | The link load, Kbit/s |
| Load (pps) | The link load, packets per second |
| Frame size (bytes) | The frame size in bytes |
| TX Medium Load | Time spent on transmitting frames (%) |
| Frame Time Used | Average loading of frame (%) - only in TDMA version |
| Total Retries | Total number of retries |
| Aggr Subframe Retries | Number of packet drops in an aggregate due to protocol excesses |
| Aggr Full Retries | Number of duplicate aggregates transmitted |
| FIFO Underrun | Number of FIFO queues underruns in the radio while transmitting |
| Excessive Retries | Number of packets which were not transmitted with maximal number of retries |
| Max aggr frames | Maximal detected number of packets in an aggregate |
| Max aggr bytes | Maximal detected bytes in an aggregate |
| Scrambled frames | The total number of scrambled frames sent |
| Tx queue overflow | Packets dropped due to queue overflow |
| Tx Cap (Mbps) | Throughput limit for DL (Mbps) - only in TDMA version |
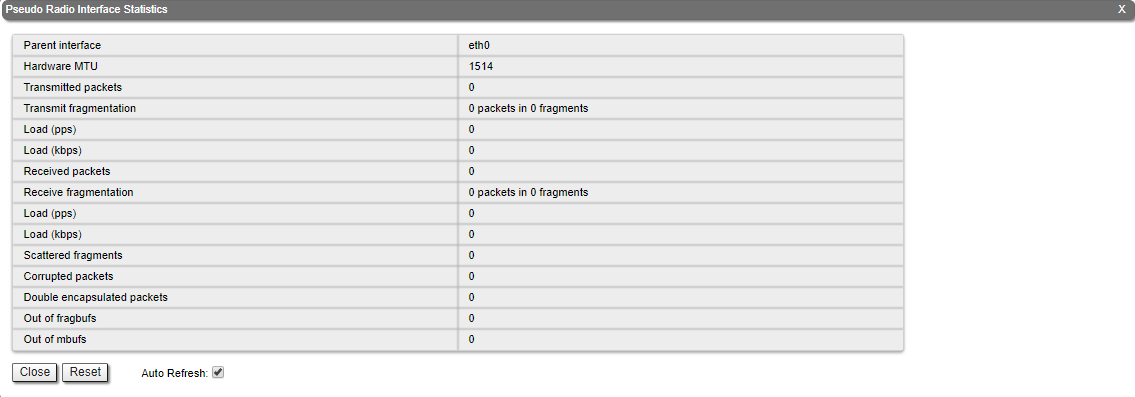
For the pseudo-radio interface information about parent interface, MTU value and load statistics is available.
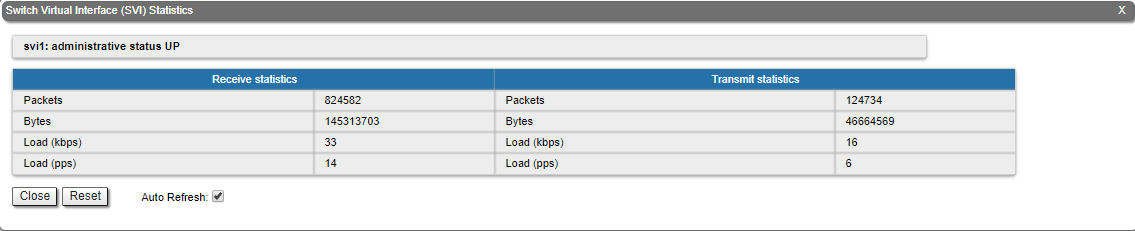
For the SVI interface information about current status, RX and TX staistics is available.
By clicking the «Close» button, you return to the "Device Status" page.
By clicking the «Reset» button, you clear all counters displayed in the page.
The "Auto Refresh" option is active by default and refreshes the statistics automatically. You can disable the auto refresh.
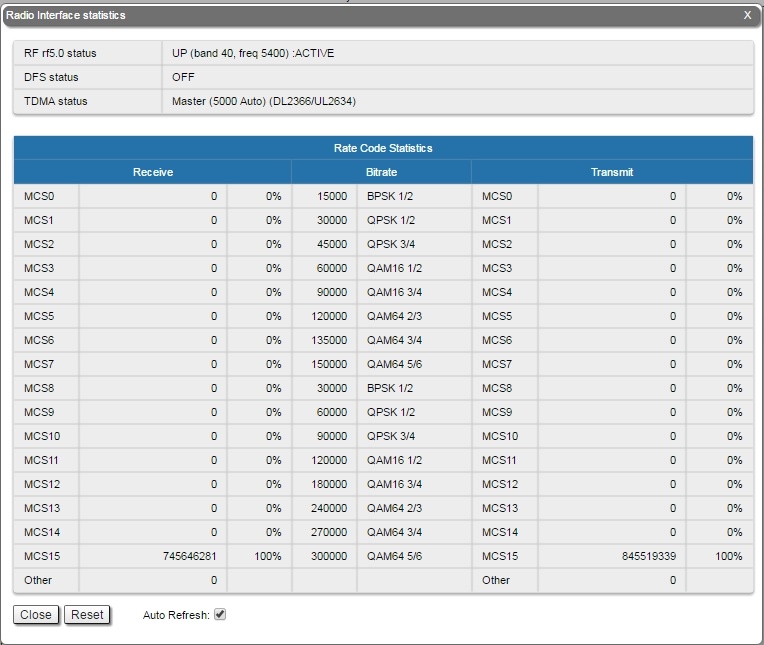
Modulation Statistics
The "Modulation Statistics" tool displays the information about modulation types, such as receive and transmit statistics for different coding scheme. This statistic is available in the firmware version with "TDMA" support.
By clicking the «Close» button, you return to the "Device Status" page.
By clicking the «Reset» button, you clear all counters displayed in the page.
The "Auto Refresh" option is active by default and refreshes the statistics automatically. You can disable the auto refresh.
Errors/Drops Statistics
The "Errors/Drops Statistics" tool displays the number of errors and link drops during transmission for each link.

By clicking the «Close» button, you return to the "Device Status" page.
By clicking the «Reset» button, you clear all counters displayed in the page.
The "Auto Refresh" option is active by default and refreshes the statistics automatically. You can disable the auto refresh.
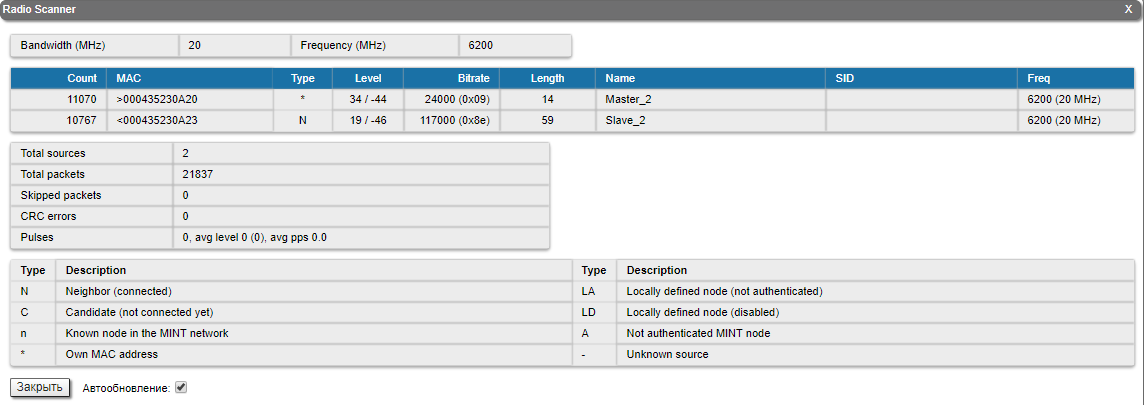
Radio Scanner
The "Radio Scanner" tool allows to estimate the efficiency of the radio links utilization, analyzing the radio-frequency environment for the current frequency, under the current channel bandwidth, without the radio link interruption and displays the following statistics:
- Radio parameters of every source in the radio link
- Number of sources, number of packets, including the skipped ones
- Number of pulses, their average level and average number of pulses per second
| Parameter | Description |
|---|---|
| Count |
|
| MAC |
|
| Type |
|
| Level |
|
| Bitrate |
|
| Length |
|
| Name |
|
| SID |
|
| Freq |
|
| Total sources |
|
| Total packets |
|
| Skipped packets |
|
| CRC errors |
|
| Pulses |
|
The abbreviations for each node type are also displayed in the interface:
| Type | Description |
|---|---|
| N |
|
| C |
|
| n |
|
| - |
|
| LA |
|
| LD |
|
| A |
|
| * |
|
| T |
|
NOTE
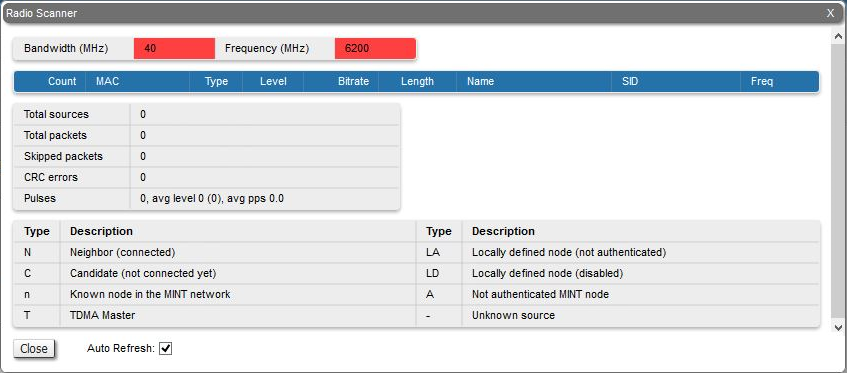
"Frequency" and "Bandwidth" are highlighted in red when the frequency and bandwidth values are already not the same as they were when Radio Scanner was started. This may occur when several profiles at the subscriber terminal link settings are configured. While searching the base station sector the subscriber terminal loops through all available profiles with different settings, highlighting them in red.
By clicking the «Close» button, you return to the "Device Status" page.
The "Auto Refresh" option is active by default and refreshes the statistics automatically. You can disable the auto refresh.
QoS Statistics
QoS (Quality of Service) characterizes the entire network performance which is defined by the parameters such as: throughput, latency, jitter, error rate, available bandwidth, etc. In order to provide the guaranteed Quality of Service for certain applications, users or data flows, different prioritization methods are used.
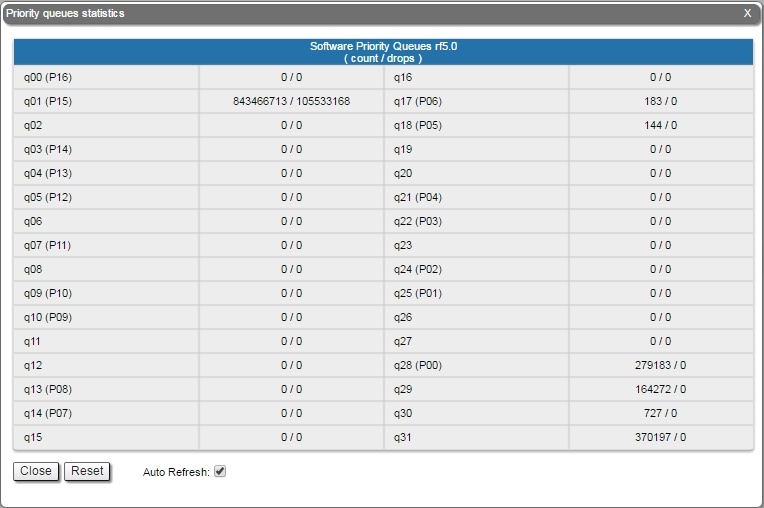
The "QoS Statistics" tool displays the statistics of the MINT priority queues for the interface.
Priority is one of the parameters which define in what sequence, different types of data traversing every InfiNet device in MINT network are treated. Each channel may be assigned a priority (for example: P01, P02 … P16).
Once assigned, a priority is automatically recognized by every node inside the MINT network. Each priority value corresponds to a device queue. Once in a queue, every packet is scheduled according to the queuing algorithm set on the device. QM manager supports "Strict Priority Queuing" and "Weighted Fair Queuing" scheduling algorithms. "Strict Priority Queuing" means that the packets from queue with lower priority are not processed until the queue with higher priority is not empty. "Weighted Fair Queuing" uses weights for every queue of an interface and allows different queues to have different service shares, depending on that weight.
Every channel is also characterized by the latency parameter. This parameter determines the maximum time for the packets to stay in the channel. If a packet is waiting in a queue of the channel more than the time specified in the latency parameter, then it is discarded. Latency can be set for each channel in the "Traffic Shaping" section.
| Queue name | Priority/Queue number |
|---|---|
| QM_PRIO_NETCRIT | 0 |
| QM_PRIO_VOICE | 1 |
| QM_PRIO_RT1 | 2 |
| QM_PRIO_VIDEO | 3 |
| QM_PRIO_RT2 | 4 |
| QM_PRIO_QOS1 | 5 |
| QM_PRIO_QOS2 | 6 |
| QM_PRIO_QOS3 | 7 |
| QM_PRIO_QOS4 | 8 |
| QM_PRIO_BUSINESS1 | 9 |
| QM_PRIO_BUSINESS2 | 10 |
| QM_PRIO_BUSINESS3 | 11 |
| QM_PRIO_BUSINESS4 | 12 |
| QM_PRIO_BUSINESS5 | 13 |
| QM_PRIO_BUSINESS6 | 14 |
| QM_PRIO_BUSINESS7 | 15 |
| QM_PRIO_BUSINESS8 | 16 |
Transparent packet prioritization is a WANFLeX feature which allows QM manager to transparently map 802.1p/TOS/DSCP priority to MINT priority for the ease of deployment.
You have to make sure that “Dot1p Tags” and/or “IP ToS” options are enabled in the "QoS" section.
| MINT priority | 802.1p/TOS priority/DSCP |
|---|---|
| QM_PRIO_BUSINESS8 | 00/00/00 (CS0, 000000) |
| No priority | 01/01/08 (CS1, 001xxx) |
| No priority | 02/02/16 (CS2, 010xxx) |
| QM_PRIO_BUSINESS1 | 03/03/24 (CS3, 011xxx) |
| QM_PRIO_QOS3 | 04/04/32 (CS4, 100xxx) |
| QM_PRIO_VIDEO | 05/05/40 (CS5, 101xxx) |
| QM_PRIO_VOICE | 06/06/48 (CS6, 110xxx) |
| QM_PRIO_NETCRIT | 07/07/56 (CS7, 111xxx) |
This section displays the number of inbound packets to each priority queue and the number of dropped packets:
By clicking the «Close» button, you return to the "Device Status" page.
By clicking the «Reset» button, you clear all counters displayed in the page.
The "Auto Refresh" option is active by default and refreshes the statistics automatically. You can disable the auto refresh.
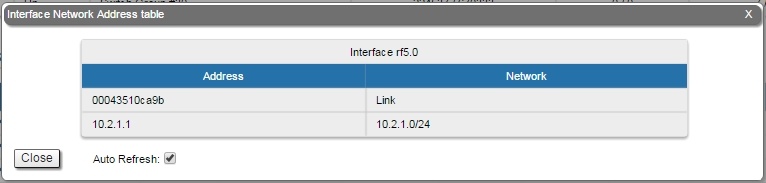
Network Address Table
The "Network Address Table" tool shows the network address table for the interface.
By clicking the «Close» button, you return to the "Device Status" page.
The "Auto Refresh" option is active by default and refreshes the statistics automatically. You can disable the auto refresh.
LLDP Information
The "LLDP Information" tool allows to get information on the link layer discovery protocol.
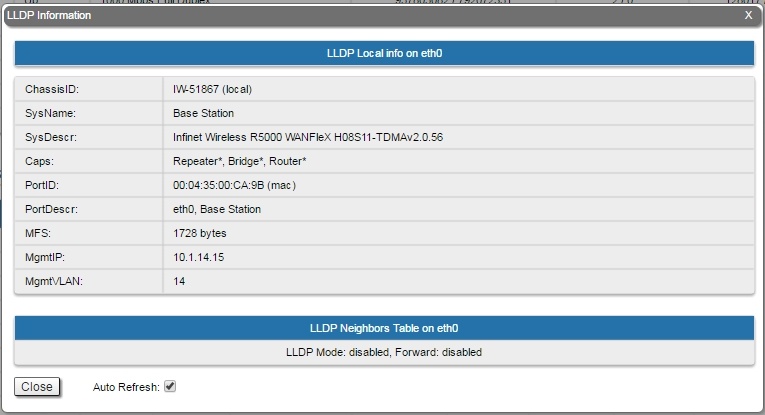
By clicking the «Close» button, you return to the "Device Status" page.
The "Auto Refresh" option is active by default and refreshes the statistics automatically. You can disable the auto refresh.
Extended Link Diagnostics
Once a wireless connection between the unit and the remote neighbor is established, it is possible to make extended diagnostics and optimization for the wireless link.
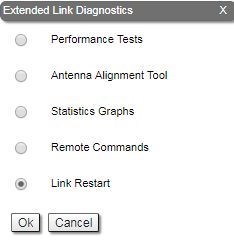
In order to access the "Extended Link Diagnostics" tools, click on the row of each wireless link within the "Links Statistics on rf5.0" section:

Five options are available: "Performance Tests", "Antenna Alignment Tool", "Statistics Graphs", "Remote Commands" and "Link Restart".
Performance tests
The "Performance tests" tool performs link throughput tests for the configured channel bandwidth and on the current frequency, without radio link interruption.
The "Performance tests" tool generates traffic between the devices and displays the channel throughput for the traffic with chosen priority. For the full throughput tests of the channel, you must set the highest priority “0” for the test traffic. In this case, the transmission of any other traffic is stopped for the testing time and the traffic generated by the tool will occupy all the channel.
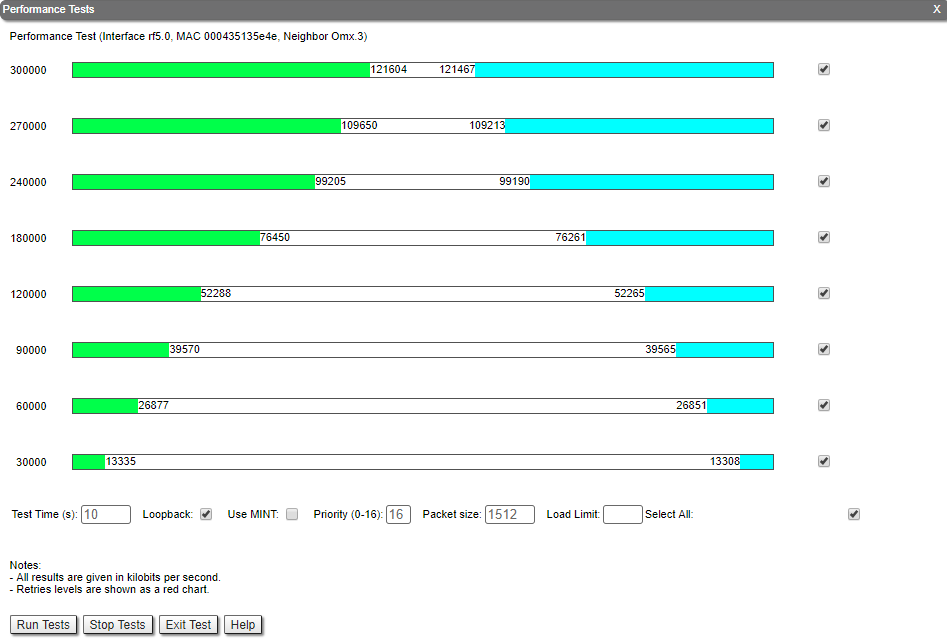
The "Performance tests" tool displays the values of the full channel throughput which is available under the current settings, for each bitrate.
NOTE
All results are given in kilobits per second and retries levels are shown as a red chart.
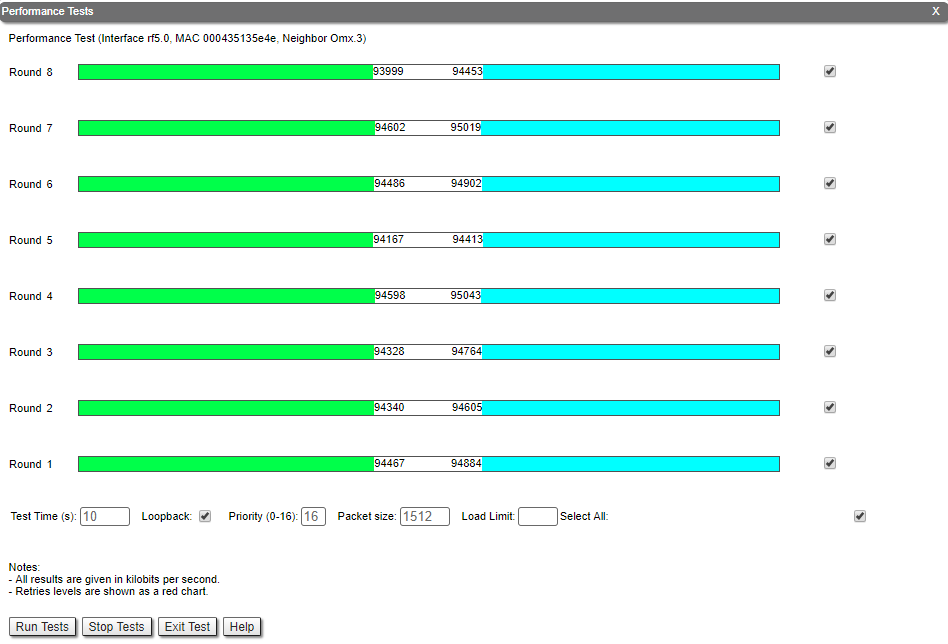
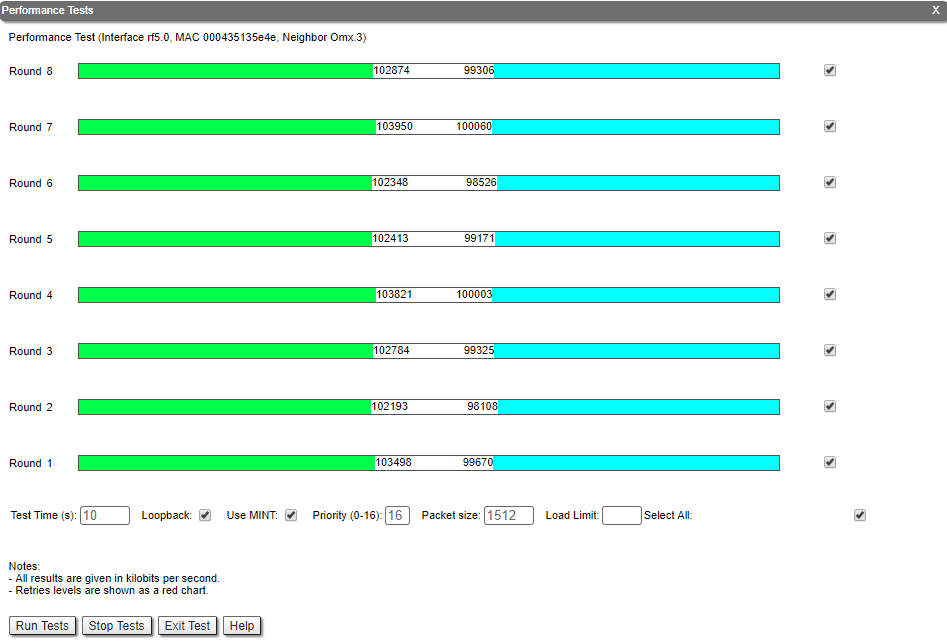
Performance tests for "MINT" and "TDMA" firmware are not the same. There are two tests in "MINT": one with graduation on bitrate, other in "Use MINT" mode. In "Use MINT" mode 8 tests are performed on established bitrate. In case of "TDMA" firmware teat of graduation on bitrate is not performed. Both firmware support bidirectional test.
By clicking the «Run Tests»/«Stop Tests» buttons at the bottom of the page, you can start/stop the performance tests.
By clicking the «Exit Test» button, you return to the "Device Status" page.
Each row corresponds to a certain bitrate value and can be selected or deselected for participating in the performance test by marking/unmarking the corresponding check-box on the right side. By marking “Select all” check-box, all the bitrates could be selected or deselected at once.
Three more parameters are available for management:
- “Test time” parameter - allows setting the duration (in seconds) of the test for each bitrate (5s by default).
- “Bidirectional” check-box - allows choosing between bi-directional (when checked) and unidirectional (when unchecked) performance test.
- "Use MINT" check-box - performs 8 tests on established bitrate.
- "Priority (0-16)" - by default, it is 16, which is lower than the data traffic that has priority 15. You can increase the test priority by setting a lower value.
- "Packet size" - allows to set the desired packet size in bytes.
- "Load limit" - sets a limit on the data rate at which the test runs, in Mbps.
The bitrates list on the "Performance test" tool consists of the bitrates that correspond to the channel bandwidth set on the unit (5/10/20/40MHz). To perform the tests for the bitrates related to the other channel bandwidth, you need to reconfigure the channel bandwidth (the “Channel Width” parameter in the "Radio Setting" section of the "Basic Settings" page) on both units within the tested link.
Examples given:
Bi-directional performance test output description for 180 Mbps bitrate (40 MHz channel bandwidth):
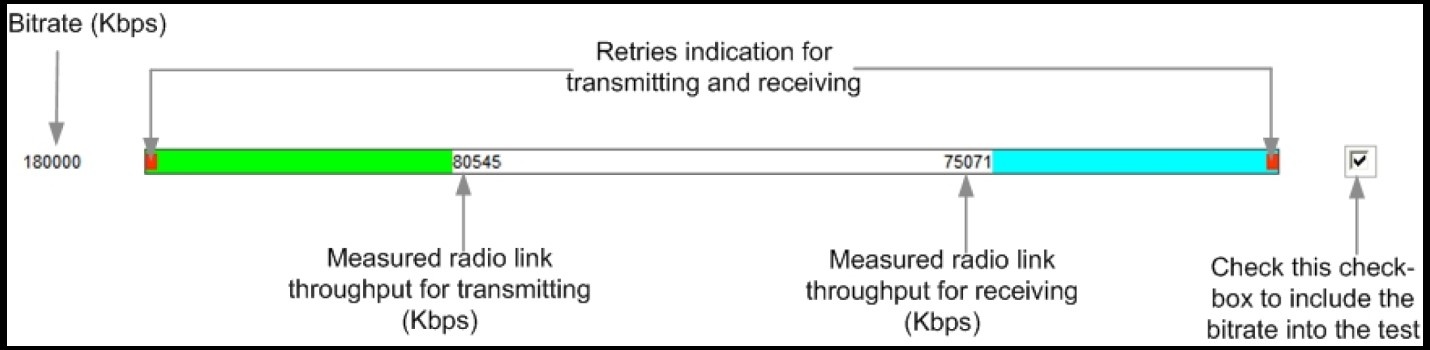
In order to see detailed information about throughput, errors and retries, you can move the mouse cursor over the indication strip of the required bitrate.
Antenna Alignment Tool
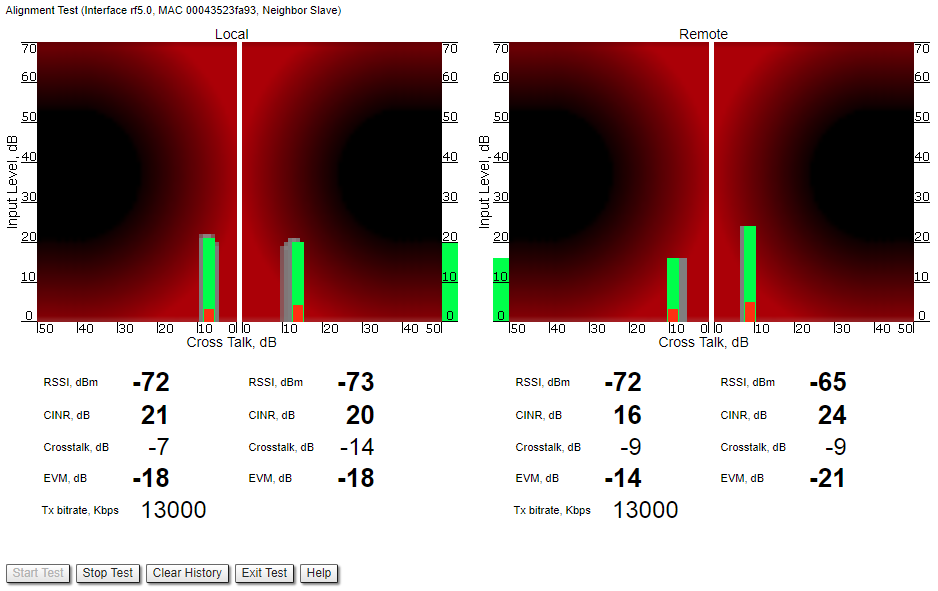
The "Antenna Alignment Tool" allows to visualize the signal characteristics on both sides of the link in order to make the antenna alignment process more accurate and easier.
The accuracy of the antenna alignment at the neighbor device is very important for the link quality.
By clicking the «Start Test»/«Stop Test» buttons at the bottom of the page, you can start/stop the alignment test.
By clicking the «Clear History» button, you delete all data stored from the moment you clicked the «Start Test» button.
By clicking the «Exit Test» button, you return to the "Device Status" page.
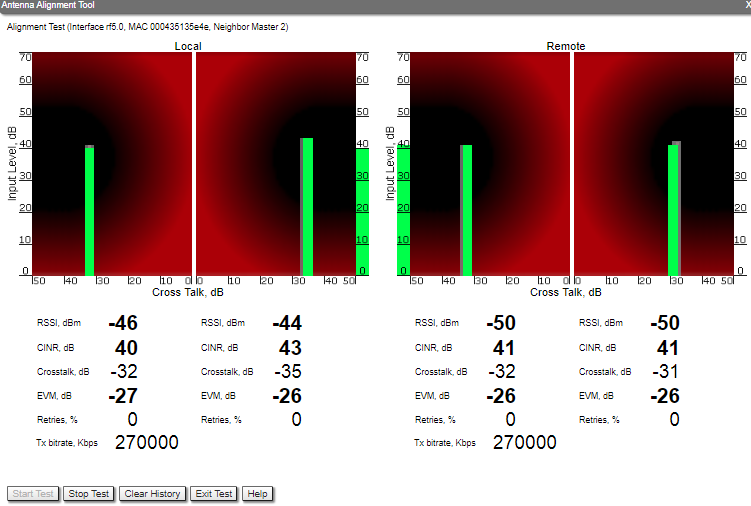
Once the test is started, the antenna alignment can be monitored using the graphic and text indicators. The indicators for both local and remote devices are displayed together in the same page which allows viewing the alignment process for both sides of the link.
Each side of the link (local and remote) has two similar test indicator sets, corresponding to each antenna polarization (one for Vertical polarization and another for Horizontal). This allows controlling the alignment process for each antenna polarization for the local and for the remote device simultaneously.
The text indicators are:
- "RSSI" - indicates the power level of the received radio signal (measured in dBm), optimal parameter value -60 ... -40.
- "CINR" - input signal level to noise + interference (measured in dB) indicator, >=28.
- "Crosstalk" - indicates how much vertically and horizontally polarized signals influence each other, >20.
- "Error Vector Magnitude (EVM)" - indicator of the measured input signal quality (it should be as high as possible in absolute value, the recommended level is not less than 21 dB. Some old firmware had EVM value positive, but most the firmware has negative value, so for the troubleshooting, evaluate the absolute EVM value), > 21 in absolute value.
- "Retries" - percentage of transmit packet retries (measured in %), <10.
- "Tx bitrate" - displays the current bitrate for the remote and local units (measured in Kbps).
Graphical indicator:
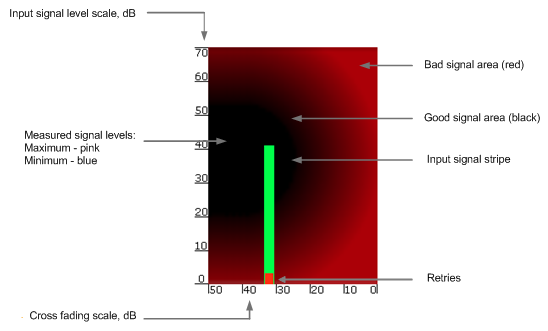
The main indicator is the Input Signal stripe.
The height of the Input Signal stripe is measured in dB by the Input Signal Level scale. The higher the stripe is, the stronger the signal is.
The stripe may change its position along the Cross Fading scale, showing how much influence the corresponding device antenna has (for example: how much vertically and horizontally polarized signals influence each other). Higher the value of the stripe according to the Cross Fading scale (the farther stripe is from the 0 dB value), less the influence antennas have on each other.
The top of the Input Signal stripe can be located in black (Good signal) or red (Bad signal) background areas or somewhere in between them. This means the signal is good, bad or average correspondingly. When aligning the antenna, it is recommended to try achieving the stripe top to be located in the black area.
At the bottom of the Input Signal stripe may appear a special red sub-stripe. This sub-stripe indicates the presence of the packet retries and the percentage of the total number of transmitted packets.
During the alignment test, the Input Signal stripe may change its position along the Cross Fading scale and increase or decrease in height, indicating the changes in the received signal. When the top of the stripe changes its location, moving from one point on the background area to another, it leaves pink and blue marks behind, indicating the maximum and minimum measured levels of the signal at a particular point. Thus, it makes possible to observe the “history” of the signal changes.
You can clear the marks by clicking the «Clear History» button at the bottom of the page.
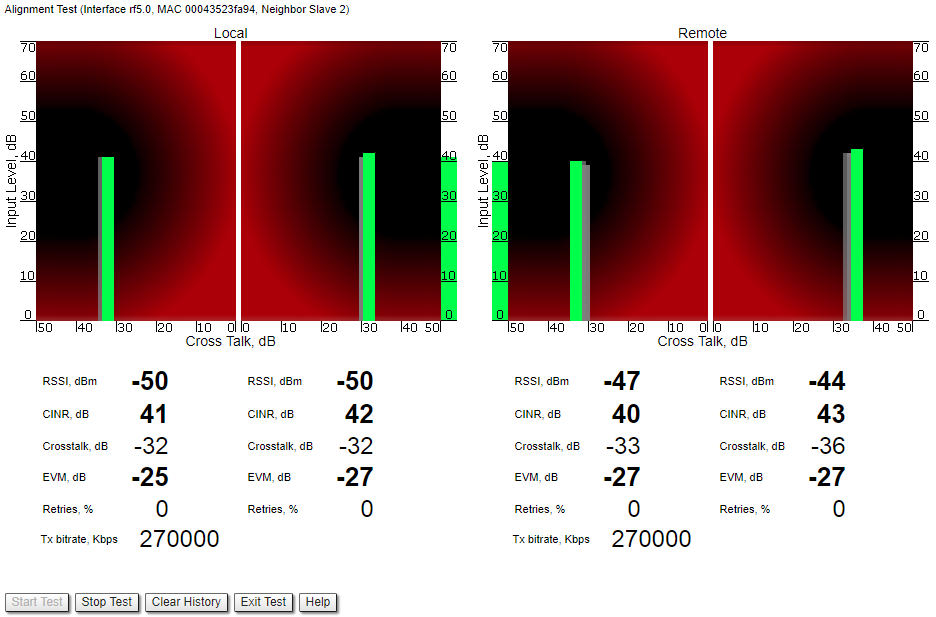
Main recommendations when using the “Antenna Alignment" tool:
- It is recommended to start antenna alignment with searching the maximum signal level on a minimal possible bitrate. Afterwards, automatic MINT mechanisms will set the most appropriate bitrate when “Autobitrate” mode is enabled.
- Input signal level (CINR) should be between 12 dB and 50 dB.
- If signal level is more than 50 dB, it is recommended to lower the amplifier power.
- If maximal signal level is less than 12, it is recommended to lower the channel width (for example: from 20 MHz to 10 MHz).
- In some cases, a signal level that is less than 12 may be enough for the radio link operation. In this case, you should be guided by parameters such as the number of retries and Error Vector Magnitude. If the number of retries is low (close to “0”) and EVM is more than 21 (Input Signal stripe is green) then the radio link is most likely, operating properly.
- Retries value should be zero or as low as possible (less than 10%).
- The top of an Input Signal stripe should be located in the black area.
- The signal quality should be good: EVM value should be more than 21.
- Input signals of the two antennas of the device should have similar Cross fading values (Input Signal stripes should be symmetrically to the value of 0 dB).
ALL described recommendations are applicable to both ("Local" and "Remote") sections.
Link samples:
- Good link sample
- Bad link sample
Statistics Graphs
The "Statistics Graphs" tool has been developed based on “digraphs”, which is a fast, flexible open source JavaScript charting library.
The "Statistics Graphs" tool allows you to monitor the device parameters represented in the graphical charts. The following modes are available: real-time monitoring, daily and monthly data logs display (use the dropdown menu from the top of the page to change the mode).
The system displays, by default, the daily data logs. All charts support simultaneous zoom to improve usability: the “zoom in” action in a certain region on any of the charts reflects on all other charts that are re-scaled automatically to display the data collected during the same period of time.
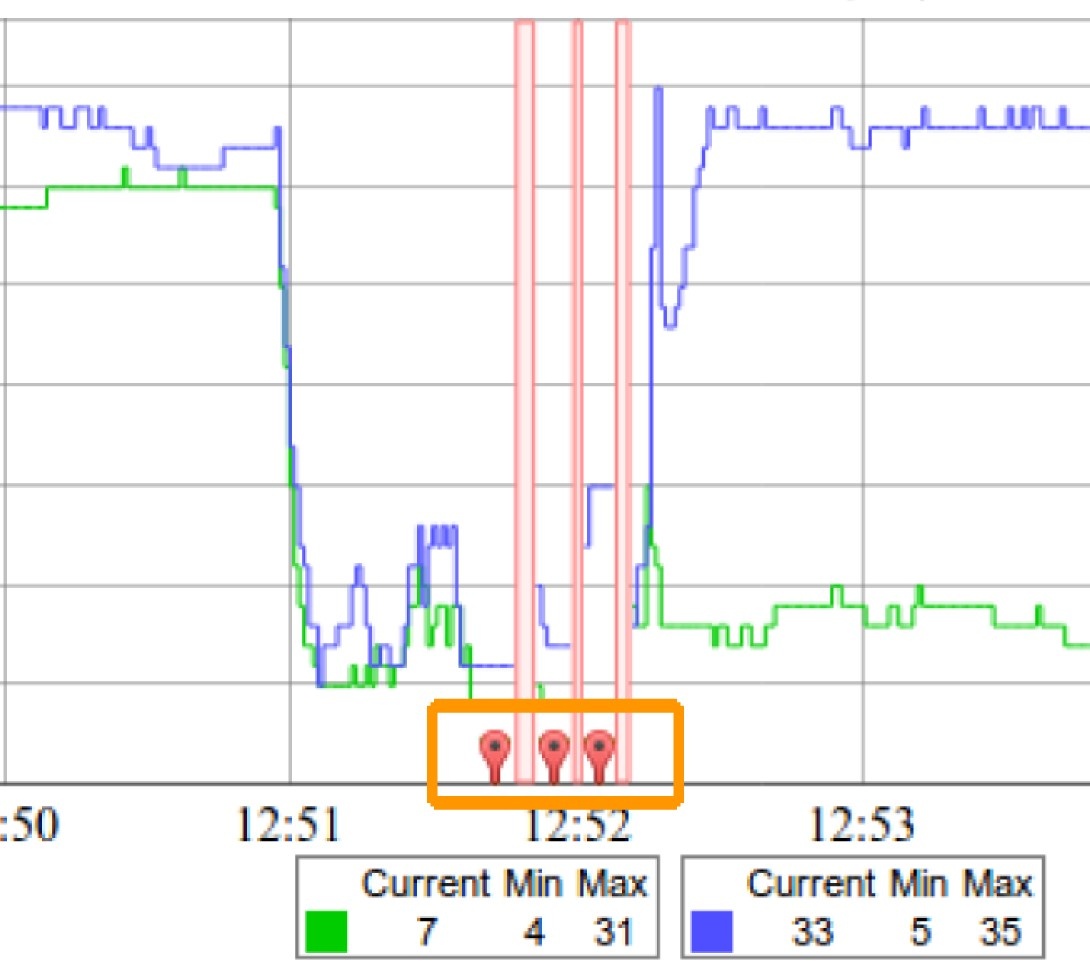
Critical events like link outages or frequency swaps are marked by small red balloons on the bottom of each graph. Move the mouse over each balloon for details:
Working with the charts:
- Select a chart region to zoom in
- Hold the «Shift» button and drag the graphs to the pan
- Double-click on any chart to reset the zoom.
The parameters that can be monitored are:

This chart displays the measured RX (green) and TX (blue) signal levels. Red regions represent link outages. The default graph uses the CINR measurement method; however, the RSSI method can be selected from the drop-down menu.
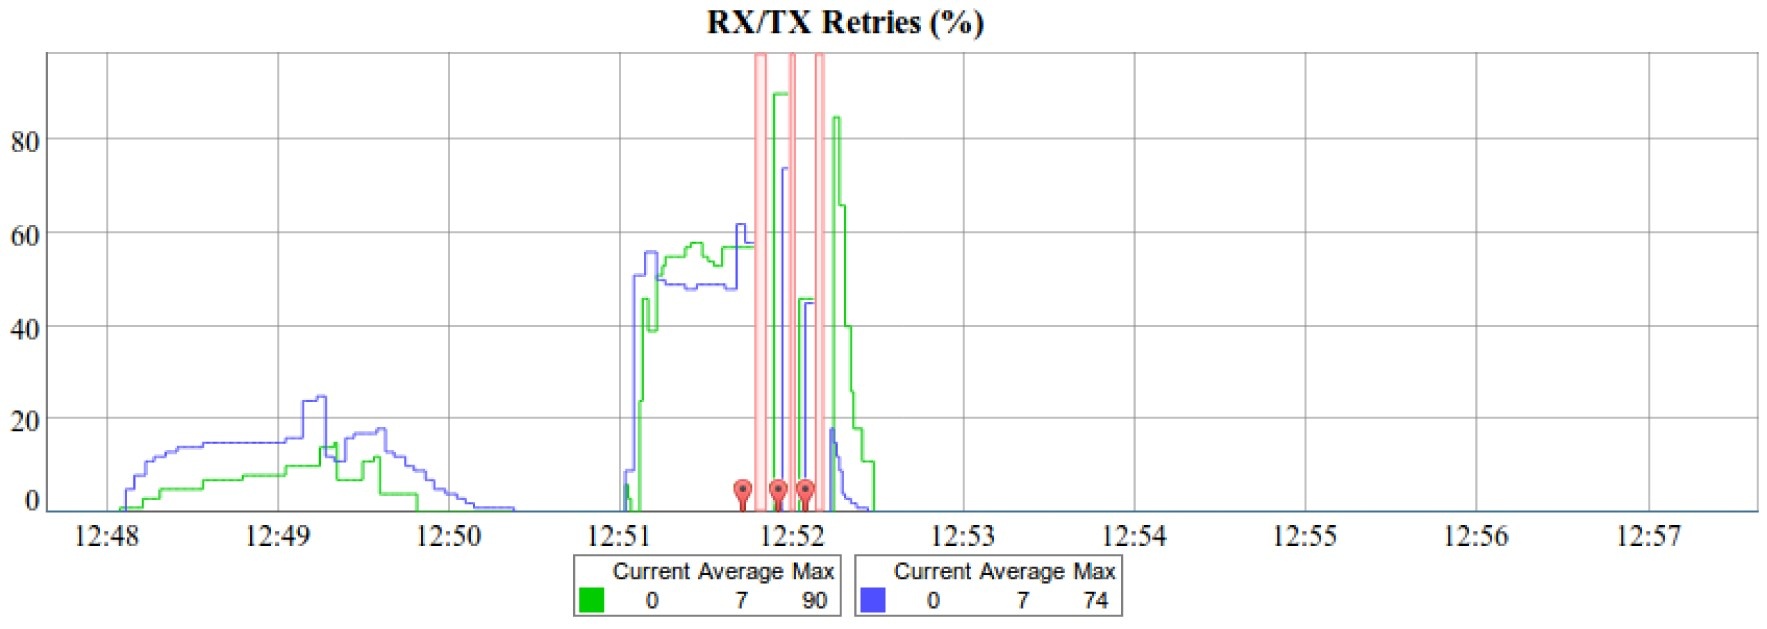
This chart displays the retry percentage (it provides a quick estimation of the link quality). Similar to the previous graph, RX retries are represented by the green lines, TX retries by the blue lines and link outages by the red lines.
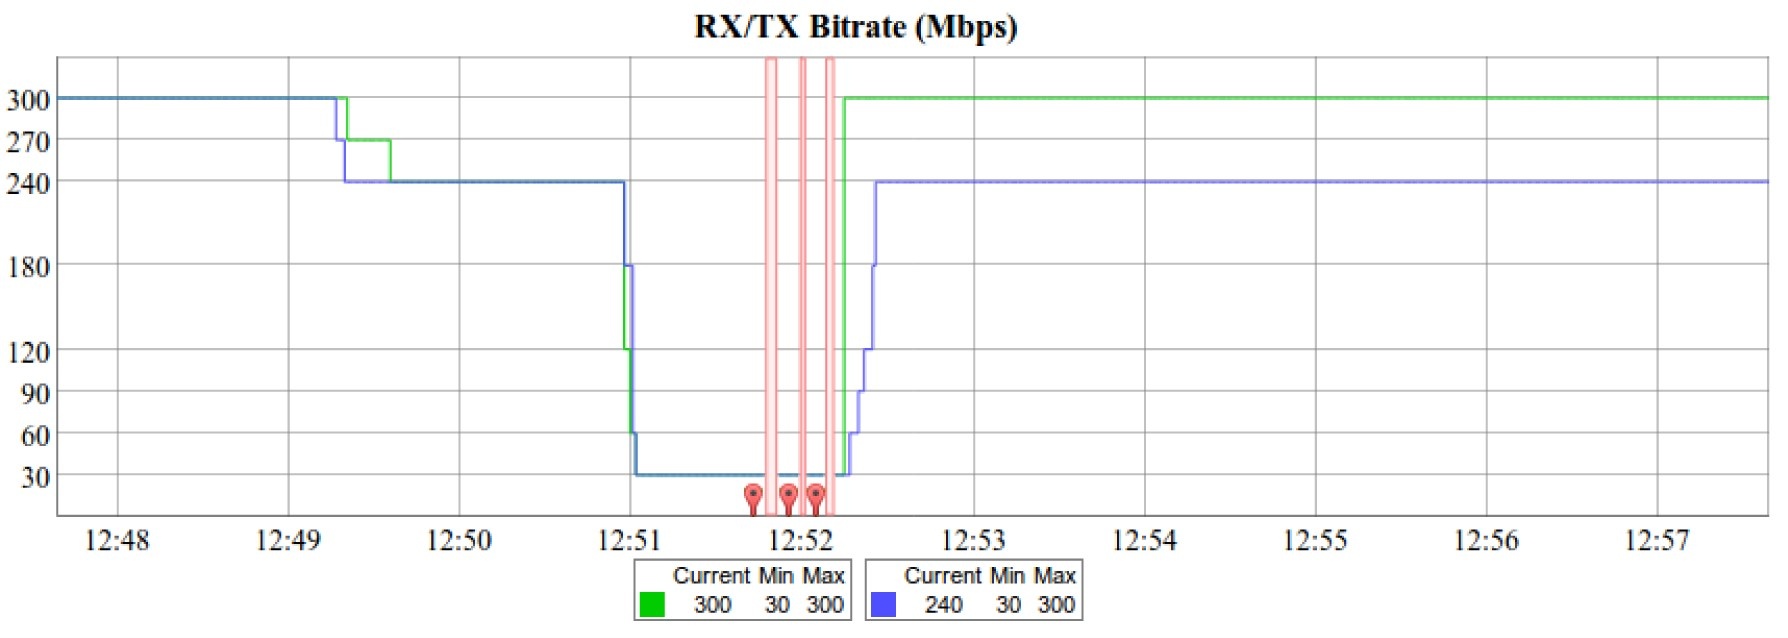
The Bitrate chart displays the bitrate for each of the two units in the link. These parameters indicate the link quality, too.
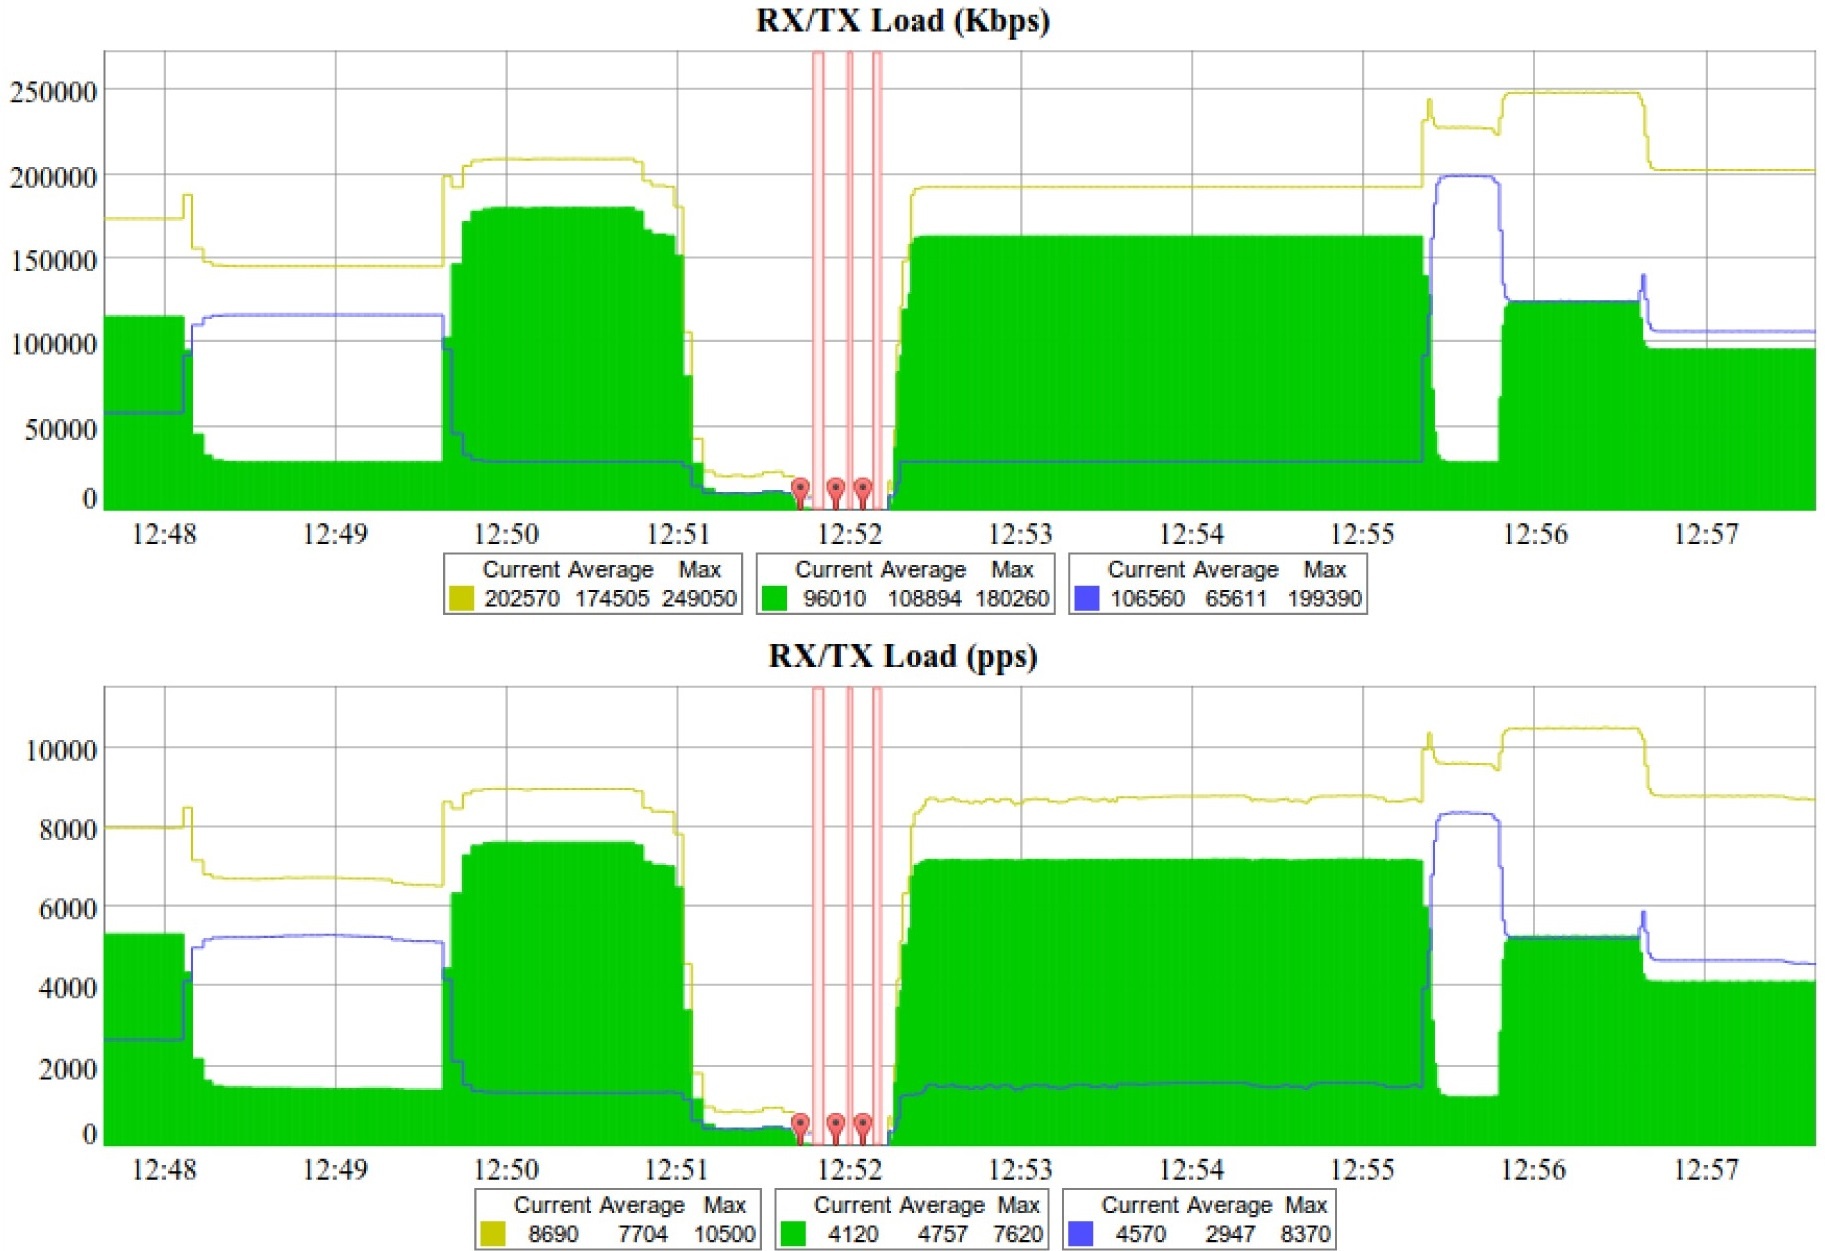
The load charts display the actual link load information, either in real time or for a set period of time. The yellow lines represent the total link load, the green lines represent the RX load and the blue lines represent the TX load.

The last chart displays the current CPU load and unit temperature (only for the units equipped with temperature sensors).
You can view the six graphs presented above into one or two columns per page by clicking the «Change Layout» button.
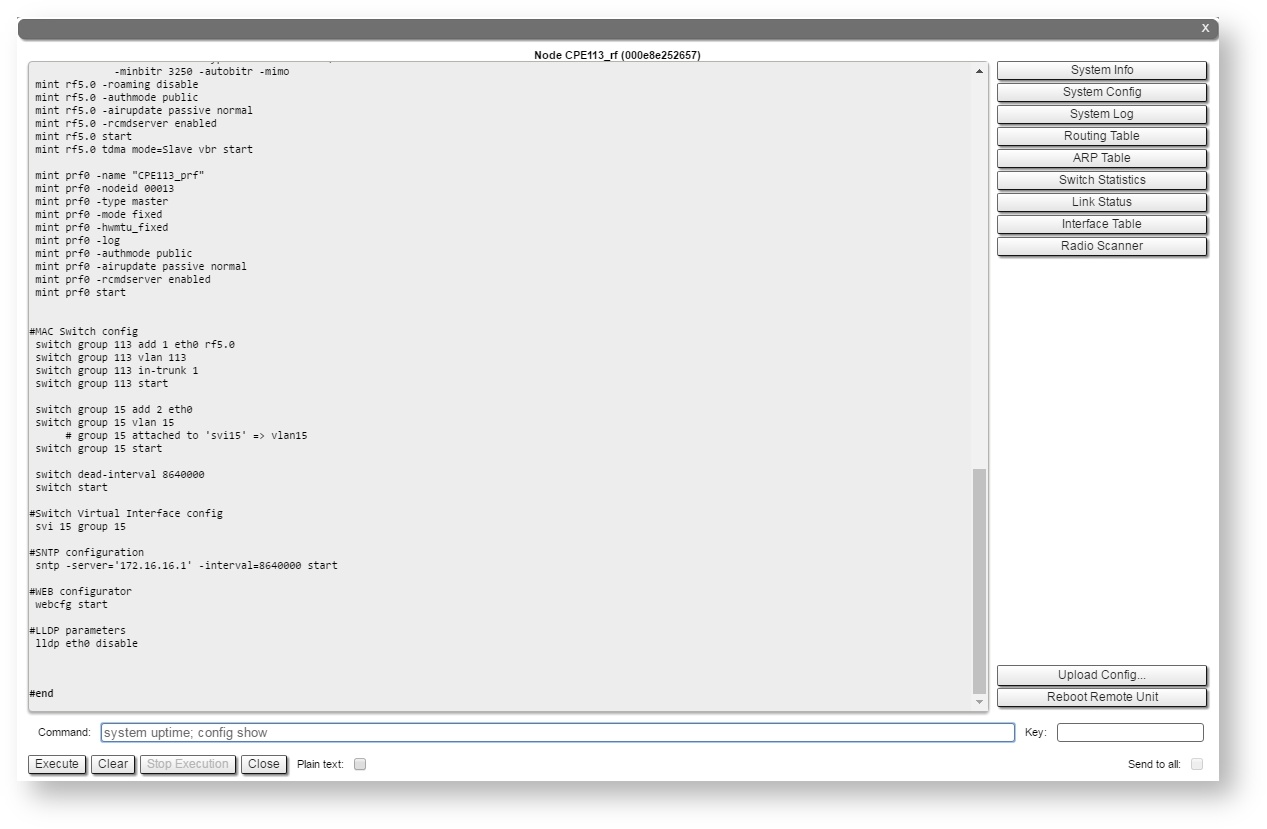
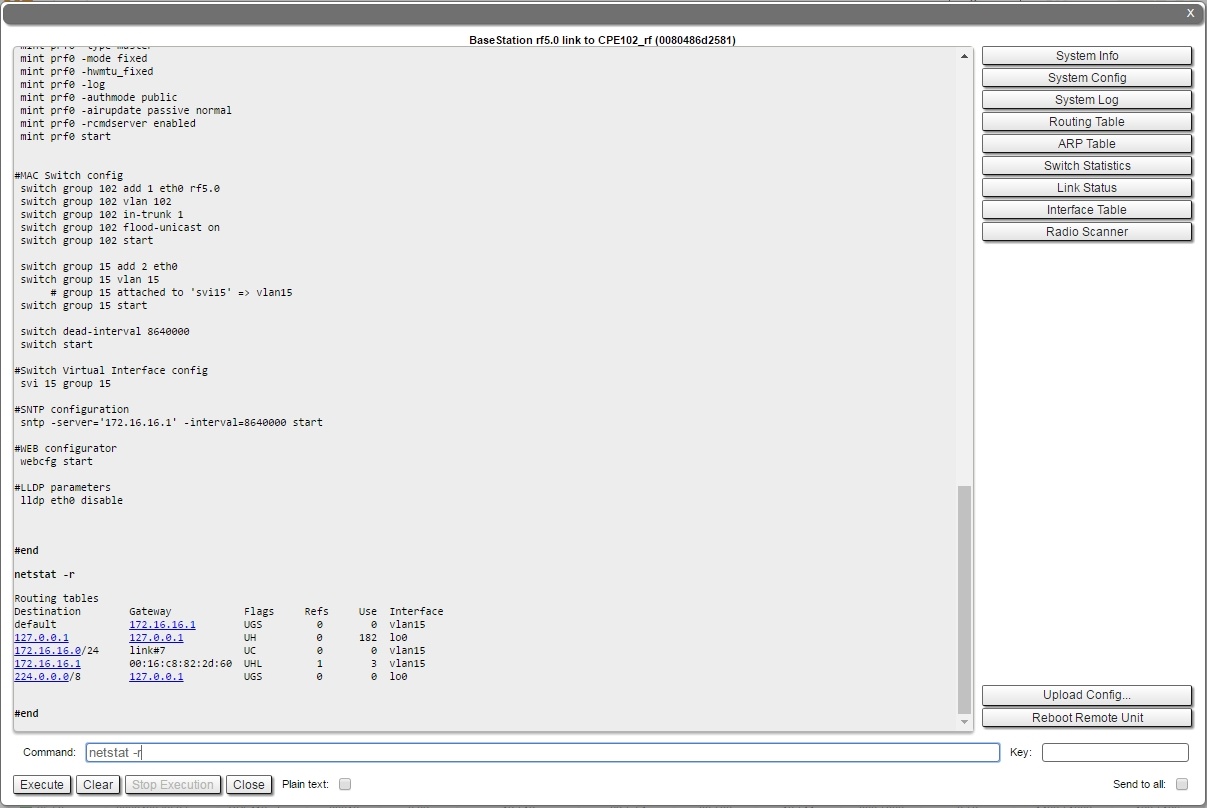
Remote Commands
The "Remote Commands" tool allows one MINT node to perform commands on another or all MINT nodes in the network at L2 level using WANFleX OS CLI commands.
Run the string you typed into the “Command” field by clicking the «Execute» button. For the full list and description of WANFleX OS CLI commands, please refer to the WANFleX OS User Manual.
You can set the key grant access to the remote node using the “Key” textbox and clicking the «Execute» button. Please note that this key must be prior set at the remote node via CLI (commands "guestKey", "fullKey" - see details in the WanFlex OS User Manual).
Erase the string you typed into the “Command” field and all output from the display section by clicking the «Clear» button.
Stop a command execution during the execution phase by clicking the «Stop Execution» button.
By clicking the «Close» button, you return to the "Device Status" page.
You can choose between plain and rich text format by marking/unmarking the corresponding checkbox.
You can execute the same command from the BS to all CPEs in the network (to the nodes that are linked to the BS) by marking “Send to all” checkbox before clicking the «Execute» button.
You can upload the configuration file to the remote node by clicking the «Upload Config…» button and you can reboot the remote node by clicking the «Reboot Remote Unit» button (a warning message pops up before the reboot).
For the ease of usage of the "Remote Commands" tool, the corresponding buttons for the most used WANFleX OS CLI commands are available in the right side of the screen:
By clicking the «System Info» button, you fill in the command field with "system version, system uptime and system cpu" commands.
By clicking the «System Config» button, you fill in the command field with "system uptime and config show" commands.
By clicking the «System Log» button, you fill in the command field with "system log show" command.
By clicking the «Routing Table» button, you fill in the command field with "netstat -r" command.
By clicking the «ARP Table» button, you fill in the command field with "arp view" command.
By clicking the «Switch Statistics» button, you fill in the command field with "switch statistics" command.
By clicking the «Link Status» button, you fill in the command field with "mint map detail" command.
By clicking the «Interface Table» button, you fill in the command field with "netstat-i" command.
By clicking the «Radio Scanner» button, you fill in the command field with "muffer rf5.0 -t5 -p mac3" command.
All commands are executed automatically after clicking one of the buttons mentioned above.
NOTE
All WANFleX OS CLI commands can be executed from the "Remote Commands" tool.
Link Restart
You can restart the wireless link (re-association, re-authentication and re-connection) by selecting the “Link Restart” radio button and then by clicking the «OK» button in the link options.
A warning message pops up before the link restart. If the operation is executed, the link disappears from "Device Status" page until it is reestablished again.

Extended Switch Statistics
The "Extended Switch Statistics" tools allow gathering complete information and enhanced statistics for each group of the unit.
In order to access the "Extended Switch Statistics" tools, click on the row of each switch group or kernel within the "Switch Statistics" section:
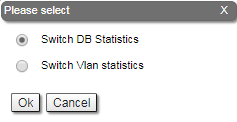
Two options are available: "Switch DB statistics" and "Switch VLAN statistics".
Switch DB Statistics
The "Switch DB Statistics" tool gathers complete information and enhanced statistics for each switch group, including kernel:

By clicking the «Close» button, you return to the "Device Status" page.
The "Auto Refresh" option is disabled by default. You can enable the auto refresh in order to have the statistics automatically refreshed.
Switch VLAN Statistics
The "Switch VLAN Statistics" tool gathers complete information and enhanced statistics for each VLAN created:

By clicking the «Close» button you return to the "Device Status" page.
The "Auto Refresh" option is disabled by default. You can enable the auto refresh in order to have the statistics automatically refreshed.