Successfully pass the free certification exam at IW Academy and become an Infinet Certified Engineer.
Reports subsystem - provides InfiMONITOR users the possibility to analyze the conditions of hosts and links. Reports, presented in graphs and data tables, helps wireless network operators to forecast changes and demands to scale the network.
"Reports" menu has the following sections:

- Switch between Links and Hosts graghs.
- Parameter selection. Links and hosts have different parameters specified below.
- View:
- Linear graph.
- Data table.
- Time range.
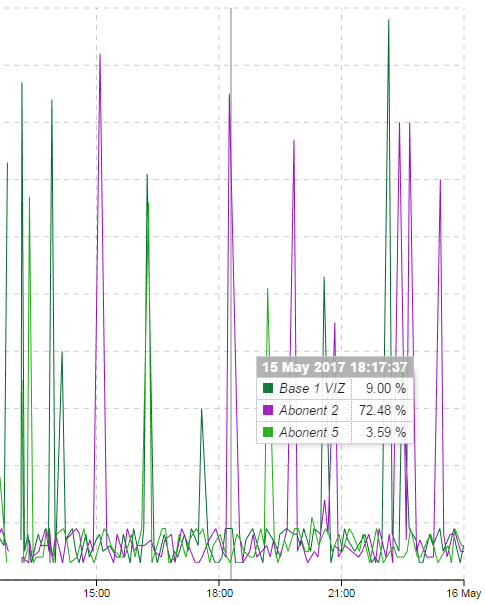
Linear graph
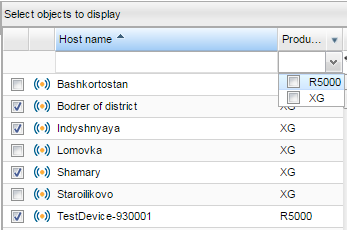
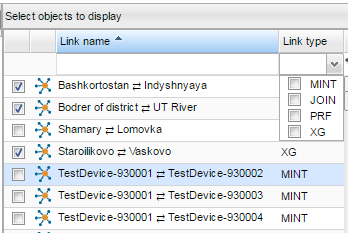
"Linear graph" graphs show data for selected hosts and links only. They can be selected in the right sidebar.
NOTE
The maximum number of objects displayed on graph simultaneously: hosts - 10, links - 3.
The hosts can be filtered by the "Product family", links - by the "Link type".
NOTE
List of selected hosts and links is kept while switching from one graph to another. Use "Deselect all" to reset selection.
Graphs can be created per different parameters of hosts and links:
| Parameter | |
|---|---|
| Host |
|
| Link |
|
The graph generates using the following values:
- X-direction - time range.
- Y-direction - parameter value.
Color indication for each line provides better visualization of the linear graphs.
The timestamp is fixed, thus when you select a point on the graph (vertical line), the parameter values for all hosts/links are displayed in the new table:
- top table row - selected time;
- first column - host/link name;
- second column - parameter value.
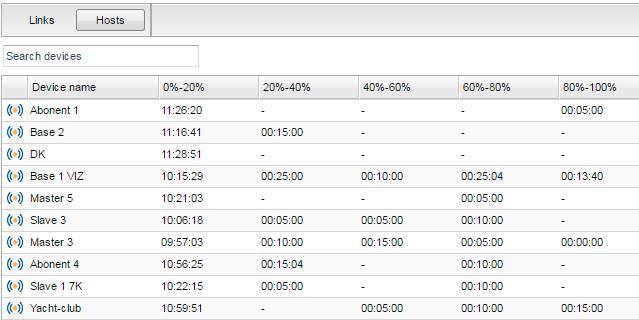
Data table
"Data table" generates for all available hosts.
- first column - available hosts list.
- next columns - selected parameter ranges.
The table cell indicates the time when the host parameter had indicated range value.
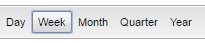
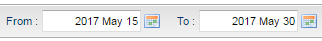
Time range
The subsystem allows users to select the time range for the graphs generation. The arbitrary or predefined date and time can be selected.