...
- Switch between Links and Hosts graghs.
- Parameter selection. Links and hosts have different parameters specified below.
- View:
- Linear graph.
- Data table.
- Time range.
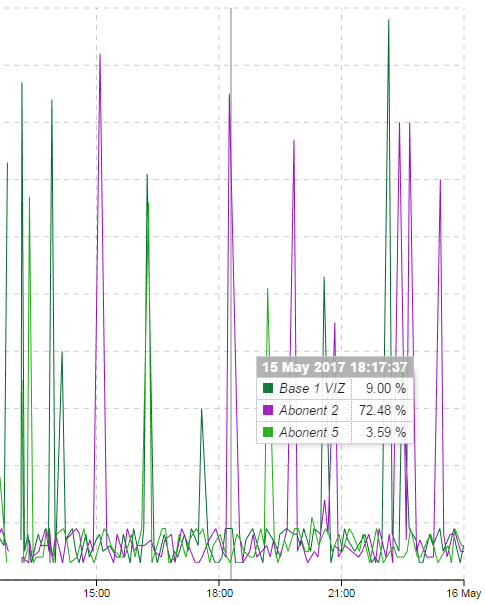
Linear graph
"Linear graph" graphs show data for selected hosts and links only. They can be selected in the right sidebar.
...
| Center | |||||
|---|---|---|---|---|---|
|
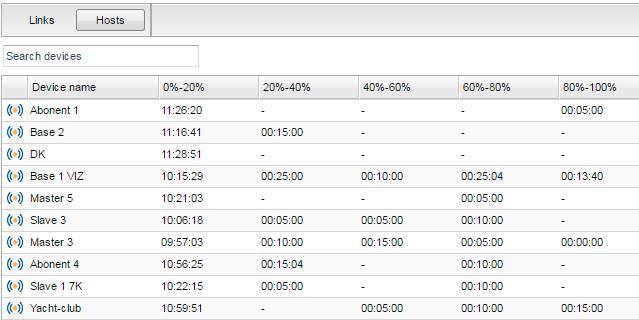
Data table
"Data table" generates for all available hosts.
...
| Center | |||||
|---|---|---|---|---|---|
|
Time range
The subsystem allows users to select the time range for the graphs generation. The arbitrary or predefined date and time can be selected.
...