The graphical antenna alignment tool allows to visualize the signal characteristics on both sides of the link in order to make the antenna alignment process more accurate and easier.
The accuracy of the antenna alignment at the neighbor device is very important for the link quality.
By clicking the «Start Test»/«Stop Test» buttons at the bottom of the page, you can start/stop the alignment test.
By clicking the «Clear History» button, you delete all data stored from the moment you clicked the «Start Test» button.
Once the test is started, the antenna alignment can be monitored using the graphic and text indicators. The indicators for both local and remote devices are displayed together in the same page which allows viewing the alignment process for both sides of the link.
Each side of the link (local and remote) has two similar test indicator sets, corresponding to each antenna polarization (one for Vertical polarization and another for Horizontal). This allows controlling the alignment process for each antenna polarization for the local and for the remote device simultaneously.
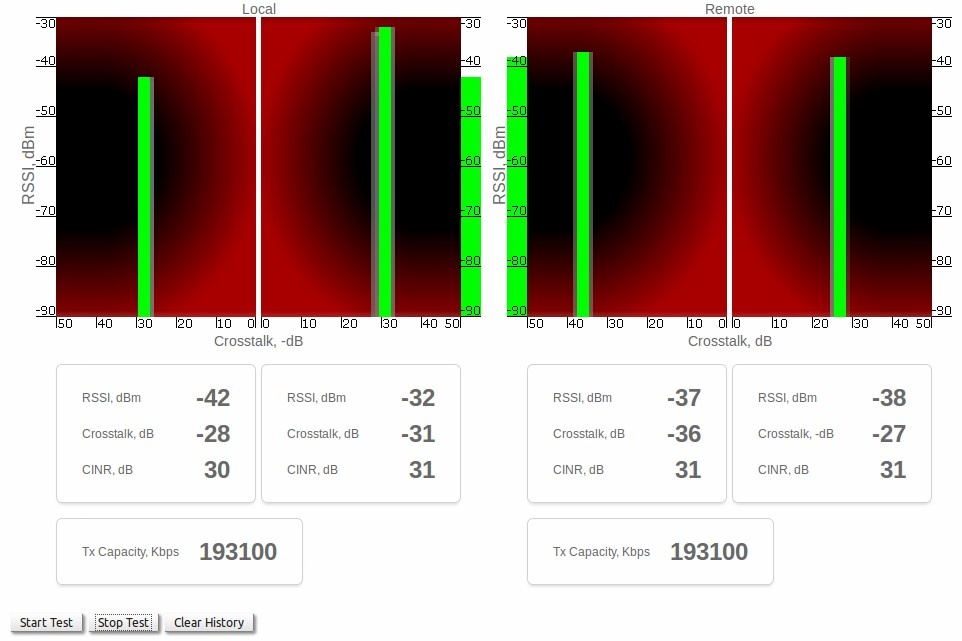
The text indicators are:
- "RSSI" - indicates absolute level of the received radio signal (measured in dBm)
- "Crosstalk" - indicates how much the vertically and horizontally polarized signals interfere each other (measured in dB)
- "CINR" - indicates the signal quality (for example, how strong is the carrier signal compared to the noise plus interference level, measured in dB).
Graphical indicator:
The main indicator is the Input Signal stripe.
The height of the Input Signal stripe is measured in dBm by the RSSI scale. The higher the stripe is, the stronger the signal is.
The stripe may change its position along the Crosstalk scale, showing how much influence the corresponding device antenna has (for example, how much vertically and horizontally polarized signals influence each other). The higher the value of the stripe according to the Crosstalk scale (the farther stripe is from the 0 dB value), the less influence the antennas have on each other.
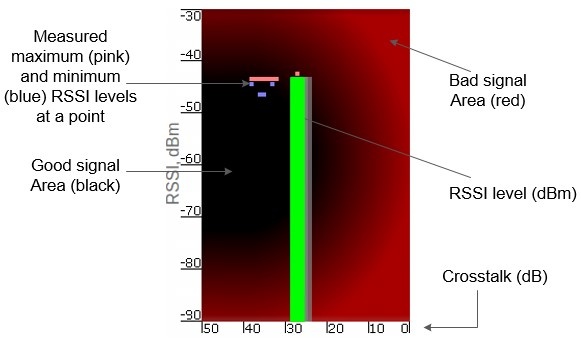
The top of the Input Signal stripe can be located in black (Good signal) or red (Bad signal) background areas or somewhere in between them. This means the signal is good, bad or average correspondingly. When aligning the antenna, it is recommended to try achieving the stripe top to be located in the black area.
At the bottom of the Input Signal stripe may appear a special red sub-stripe. This sub-stripe indicates the presence of the packet retries and the percentage of the total number of transmitted packets.
During the alignment test, the Input Signal stripe may change its position along the Cross Fading scale and increase or decrease in height, indicating the changes in the received signal. When the top of the stripe changes its location, moving from one point on the background area to another, it leaves pink and blue marks behind, indicating the maximum and minimum measured levels of the signal at a particular point. Thus, it makes possible to observe the “history” of the signal changes.
You can clear the marks by clicking the «Clear History» button at the bottom of the page.
Main recommendations when using the “Antenna Alignment" tool:
- RSSI level should be between -40 dBm and -60 dBm
- If RSSI level is more than -40 dBm, it is recommended to decrease Tx power
- CINR should be maximized during alignment
- Crosstalk should be as far as possible from 0 dB
- The top of an Input Signal stripe should be located in the black area
- Input signals of the two antennas of the device should have similar Cross fading values (Input Signal stripes should be symmetrically to the value of 0 dB).
ALL described recommendations are applicable to both (Local and Remote) sections.