...
| Center | |||||||
|---|---|---|---|---|---|---|---|
|
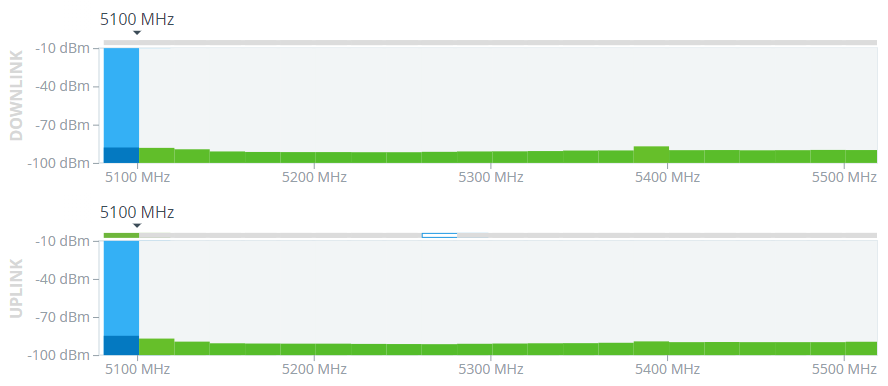
At the top of the section there is information about the status of each band participating in the scan in accordance with the frequency grid. The upper stripe displays the band status discovered by the radar detection tool. The columns show the signal levels detected by the Instant DFS tool. There is the RSSI scale displaying the level of the detected signal in this band at the left side. Band statuses are described in the legend at the bottom of the section.
...