Network map allows to visually determine the hosts connectivity and to get necessary information about hosts and links status and their active events.
There are two possible logical (topology) and geographical (map) views that can be represented with the buttons on the left top corner.
The logical view is based on logical connections between hosts, the geographical on the actual hosts coordinates.
To display network devices on the geographic map, their coordinates must be filled in using the web interface or command line.
Switching to the web interface and management via the command line are available after selection of a device on the map.
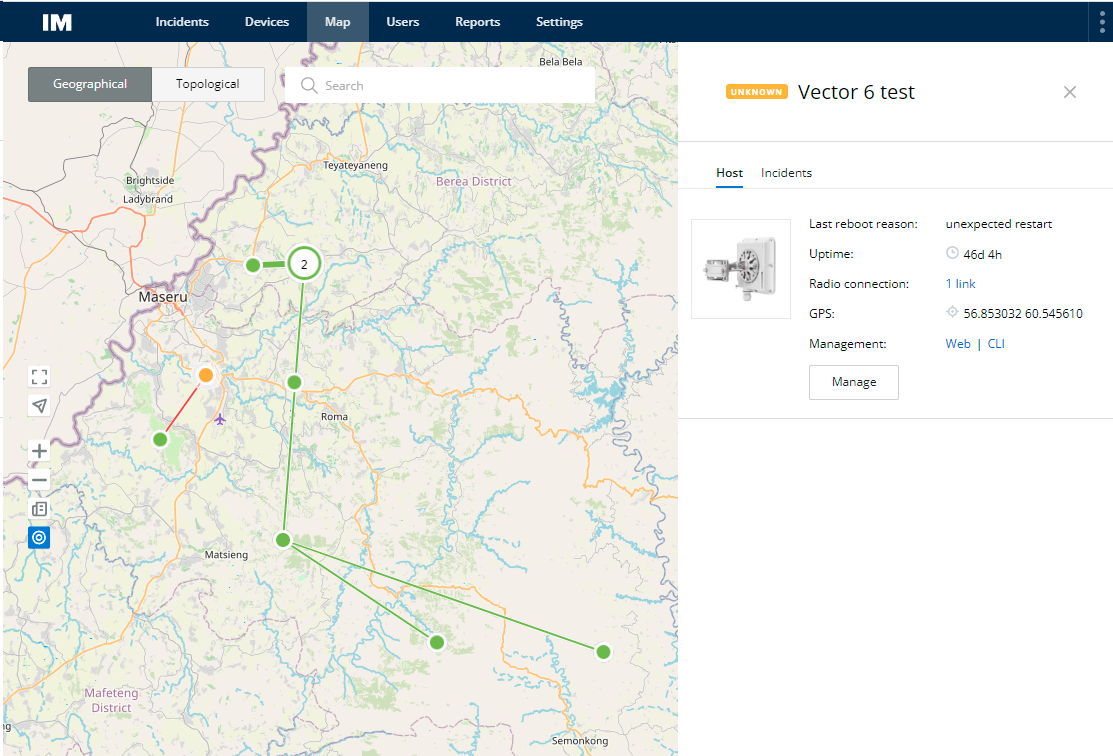
Represented information
Each network host is represented as a separate point on the map . The point color depends on the current host status.
Host and link statuses information is updated in real-time.
Hosts clustering
For more convenient monitoring of a large number of hosts, the map performs their automatic joining into the cluster. The cluster is simply a visual object, it does not determine the logical hosts grouping. The more you are zoom out the map view the more number of hosts comes into one cluster, and on the contrary, the more you are zoom in the more number of hosts will be shown as a separate point. Clicking on a cluster will display a list of including hosts.
Monitoring
For detailed information on each host click on it to get properties panel. Links are represented as lines, the color of which depends on the connectivity between hosts. For detailed information on required link click on it to get properties panel.