Successfully pass the free certification exam at IW Academy and become an Infinet Certified Engineer.
Performance tests
Web interface
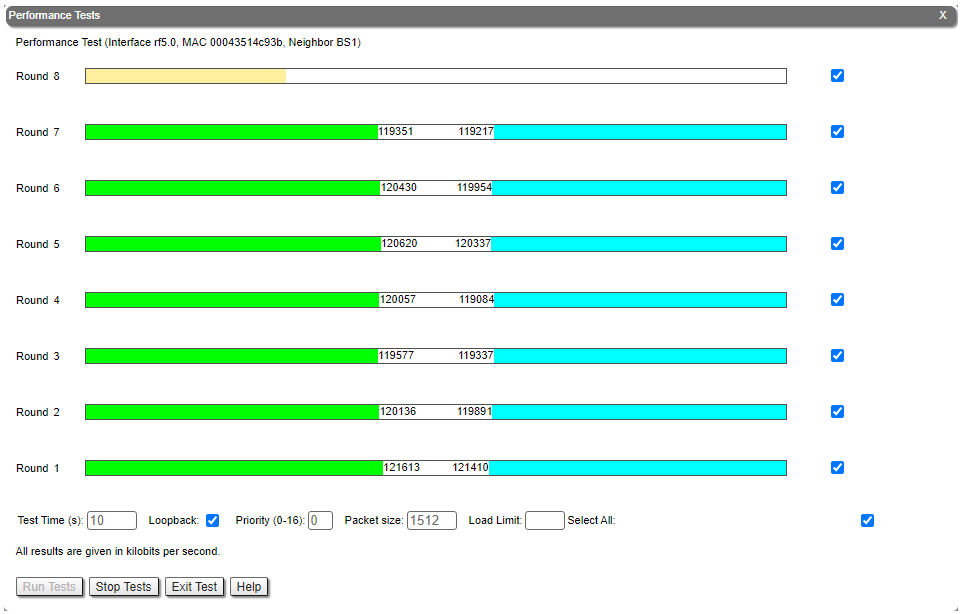
The throughput test can be performed with the "Performance Tests" tool built into the web interface in the section "Device status" → "Link statistics for the rf5.0 interface". This tool generate test traffic, it allows to obtain data about the real link throughput both in one direction and in a two-way manner. Throughput evaluation are made for traffic with the specified priority without taking into account the service traffic required to maintain the link operation. To exclude the influence of data traffic on the test result, it is recommended to set the highest priority for test traffic (at least 15). When the MINT testing mode is enabled (the "use MINT" checkbox), performance tests are always performed on the highest modulation, otherwise testing will be performed on each modulation available. The detailed parameters description and performance tests settings is available in the "Device Status menu" article.
Command line interface
When using the command line interface to manage the device, it is possible to test the radio link via the "ltest" command.
Wireless connection status
Link statistics on rf5.0 interface
Web interface
To evaluate the wireless connection quality with the neighboring device use the color indication in the "Status" column of the "Link statistics on rf5.0" subsection:
- Red: bad connection.
- Yellow: good connection.
- Green: perfect connection.
The following symbols indicate problems:
At the wireless connection uptime column:
F - the local device has a newer software version than the remote.
E - the Ethernet port of the remote device is flapping.
- At the TX power column:
- * - hardware device failure.
- At the RSSI column (only for software with TDMA technology support):
- * - significant difference in the signals power of vertical and horizontal polarizations.
Make sure the "TX Power" and "Bitrate" parameters match the values of the planning phase. In the "Link statistics on rf5.0" of the "Device status" section, pay attention to the wireless connection parameters. The main parameters are the retries number and the bitrate. It is not recommended to use the link with the retries number exceeding 5%. The actual bitrate (modulation level) depends on the SNR parameter - the signal-to-noise ratio. The highest modulations are available at SNR values of 27-50 dB.
For detailed description of the link parameters proceed to the "Device Status menu" article.
Command line interface
To display information about the wireless links status via the command line interface, use the "mint rf5.0 map detail" command.
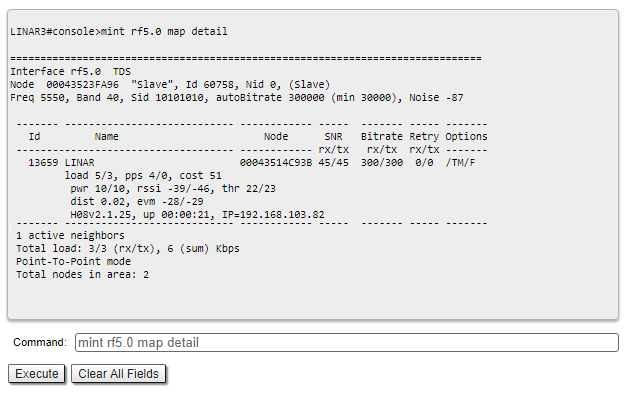
Pay attention to the indicators in the "Options" column, the following values are possible:
- M - Master device;
- S - Slave device;
- TM - Master device with software with TDMA technology support;
- P - polling mode is enabled;
- L - throughput is limited by license;
- F - the software version is older than on the local device.
A question mark in front of the remote device name indicates that it has no password.
Pay attention to the "*" symbol, which can represent the following:
- At the "pwr" column - hardware device failure.
- At the "rssi" column (only for software with TDMA technology support) - significant difference in the signals power of vertical and horizontal polarizations.
Radio statistics
Web interface
In case of a high retries level use the built-in statistics tools. "General statistics" section contains information about media loading, queue overflow, etc..
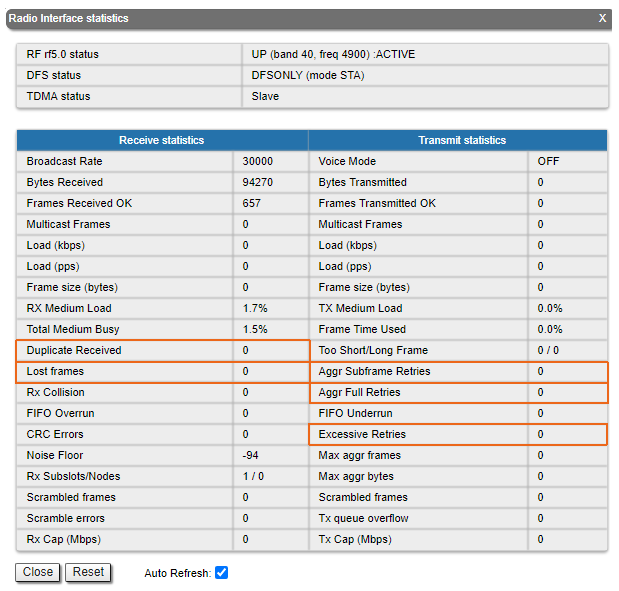
Pay attention to the following indicators:
- "Lost Frames" the frames number that were not received by the device, even after retries.
- "Duplicates Received" the frames number that were received several times due to the other side did not receive an acknowledgment of the frame receipt.
- "Aggr Subframe Retries" and "Aggr Full Retries" the frames number that the device sent several times because the other side did not acknowledge receipt.
- "Exscessive Retries" the frames number failed to send after all retry attempts.
Command line interface
To display statistic via the command line interface, use the ""rfconfig stat" command.
QoS statistic
Web interface
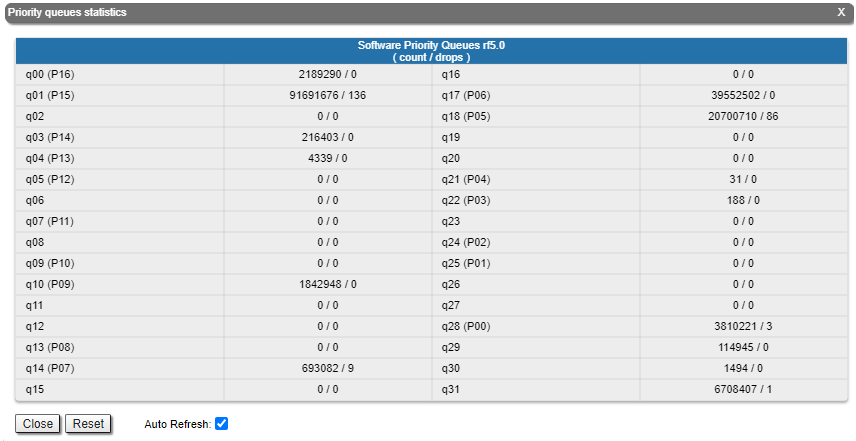
The "QoS statistics" section provides information about transmitted and dropped packets in each priority queue configured on the device. Drops in traffic processing queues indicates that the throughput threshold has been exceeded. Losses in queue q00 (P16) are acceptable because this queue contains performance test data.
Command line interface
To display statistic via the command line interface, use the "rfconfig rf5.0 stat qos" command. The dropped packets number for each configured queue can be displayed by the "qm stat" command.
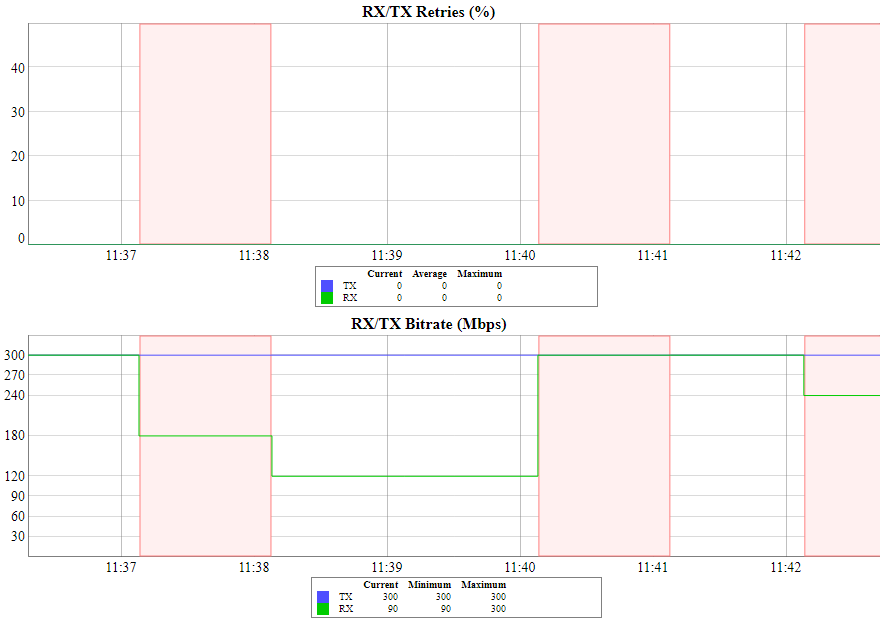
Statistics graphs
If the link has deteriorated during operation, with the initial parameters corresponding to the calculated ones, it is necessary to find out when the problem has begin. Use the "Statistics graphs" tool to determine when or how often the problem occurs by changing the display options.
Device status
Pay attention to the CPU and memory usage indicators in the "Device status" section. Excessive processes running on a device can overflow volatile memory and overload the CPU (over 95% usage), and deteriorate wireless link quality. The CPU load can be displayed with the "system cpu" command, and information about the device memory state by the "mem" command.

Last reboot reason
Disruptions in the wireless link may be caused by the device reboot. At the "Maintenance" section or at the "system uptime" command output pay attention to the last device reboot reason. Following values are possible:
- "Software fault".
- "Unexpected restart".
- "Manual restart".
- "Manual delayed restart".
- "Firmware upgrade".
- "SNMP managed restart".
- "Test firmware loaded".
- "Power-on reset".
System log
Proceed to the System Log tool in the "Device status" section or by using the "system log" command. Using the log entries, check if the link degradation was caused by a configuration change ("system reconfiguration" message). Restore the configuration previous version if necessary. Detailed information about saving and uploading configuration is available in the "General Purpose Command Set" article.
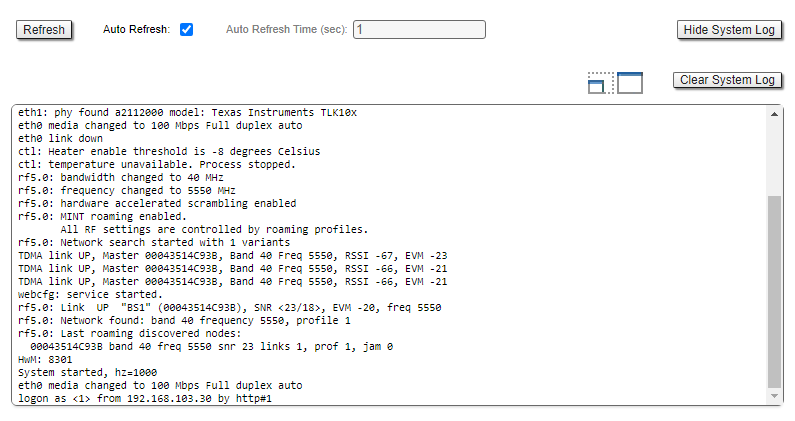
Pay attention to the following messages:
| Messages in the log | Description |
|---|---|
| Link DOWN | The wireless link has been disconnected. The reason for the disconnection is indicated in the same entry. |
"too many transmit errors" | The wireless link was interrupted due to transmission errors. |
"link reconnecting" | The wireless link is reconnected. |
| "no signal from the remote side detected" | There is no signal received, check the remote device. |
| Scrambling engine overflow | The hardware capabilities of the scrambling module are exceeded. To connect more subscribers (more than 62) scrambling should be disabled. |
| Warning: Abnormal transmit power disbalance! | May indicate a hardware problem. |
Frequent changes in the Ethernet interface status ("Up" and "Down") may indicate problems with the Ethernet interface, the cable connected to it, the power supply, or the switch.
Antenna alignment
Web interface
The link degradation can be caused by misalignment or the obstacles appearance in the signal propagation path. Use the built-in "Antenna Alignment Tool". Recommended parameters are in the table below. If the parameters differ significantly from the calculated ones, check the alignment accuracy of the devices on both link sides.
RSSI (dBm) | |
|---|---|
-90 ... -80 | The value is close to the receiver sensitivity level, only lower modulations are available |
-80 ... -60 | Low level. Average modulations are available |
-60 ... -40 | The recommended value for maximum performance |
>-40 | The received signal level is too high |
Absolute value EVM (dB) | |
>21 | Recommended value |
CINR (dB) | |
>28 | Higher modulations are available |
| Absolute value Crosstalk (dB) | |
>20 | Recommended value |
If the RSSI parameter value remains high while the CINR value is lowered, it may indicate high interference level near one of the devices. Both RSSI and CINR parameters deterioration can indicate the device misalignment. A detailed description of the "Antenna Alignment" tool is available in the "Device status menu" article.
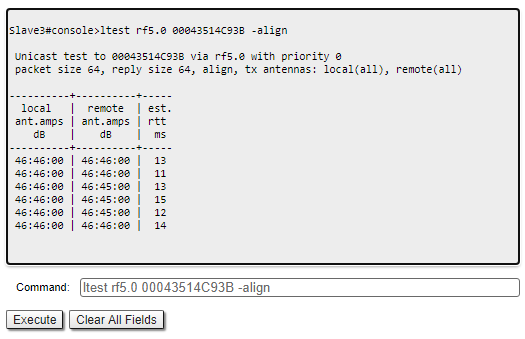
Command line interface
When using the command line to manage the device, fine antenna alignment can be performed by the "ltest rf5.0 MAC ADDRESS -align" command. The command output will show the average CINR for the local and remote devices.
Analysis of the radio environment
Web interface
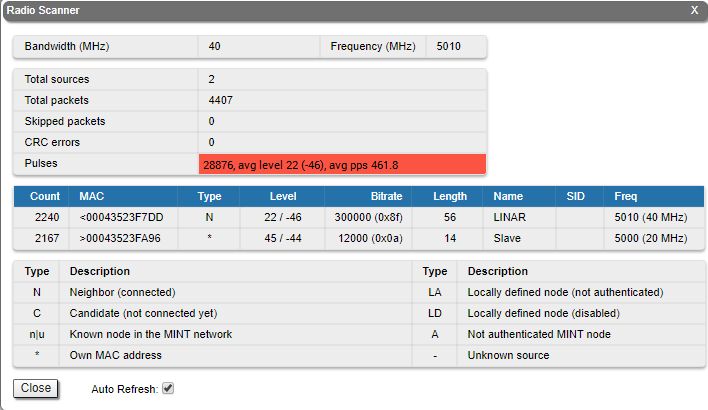
To assess the radio environment state proceed to the "Radio Scanner" tool. The tool has the following purposes:
- allows to evaluate the radio sources at the current central frequency and, if necessary, perform devices frequency diversity in order to reduce their mutual influence;
- displays information about impulse noise. The number of pulses per second over 50 indicates significant interference at the selected frequency.
Use the "Spectrum Analyzer" tool to select a frequency free from interference or use the automatic frequency selection mechanisms. For more information about the dynamic frequency selection algorithms proceed to the "Dynamic Frequency Selection" article.
Command line interface
Detailed information about the radio environment state is available via the "muffer" command. Thus "muffer rf5.0 scan" command allows to perform intension radio environment analysis for the presence of radio signal sources at all available frequencies.
NOTE
The "muffer rf5.0 scan" command can take a long time and disrupt the normal radio module operation.